Debugging
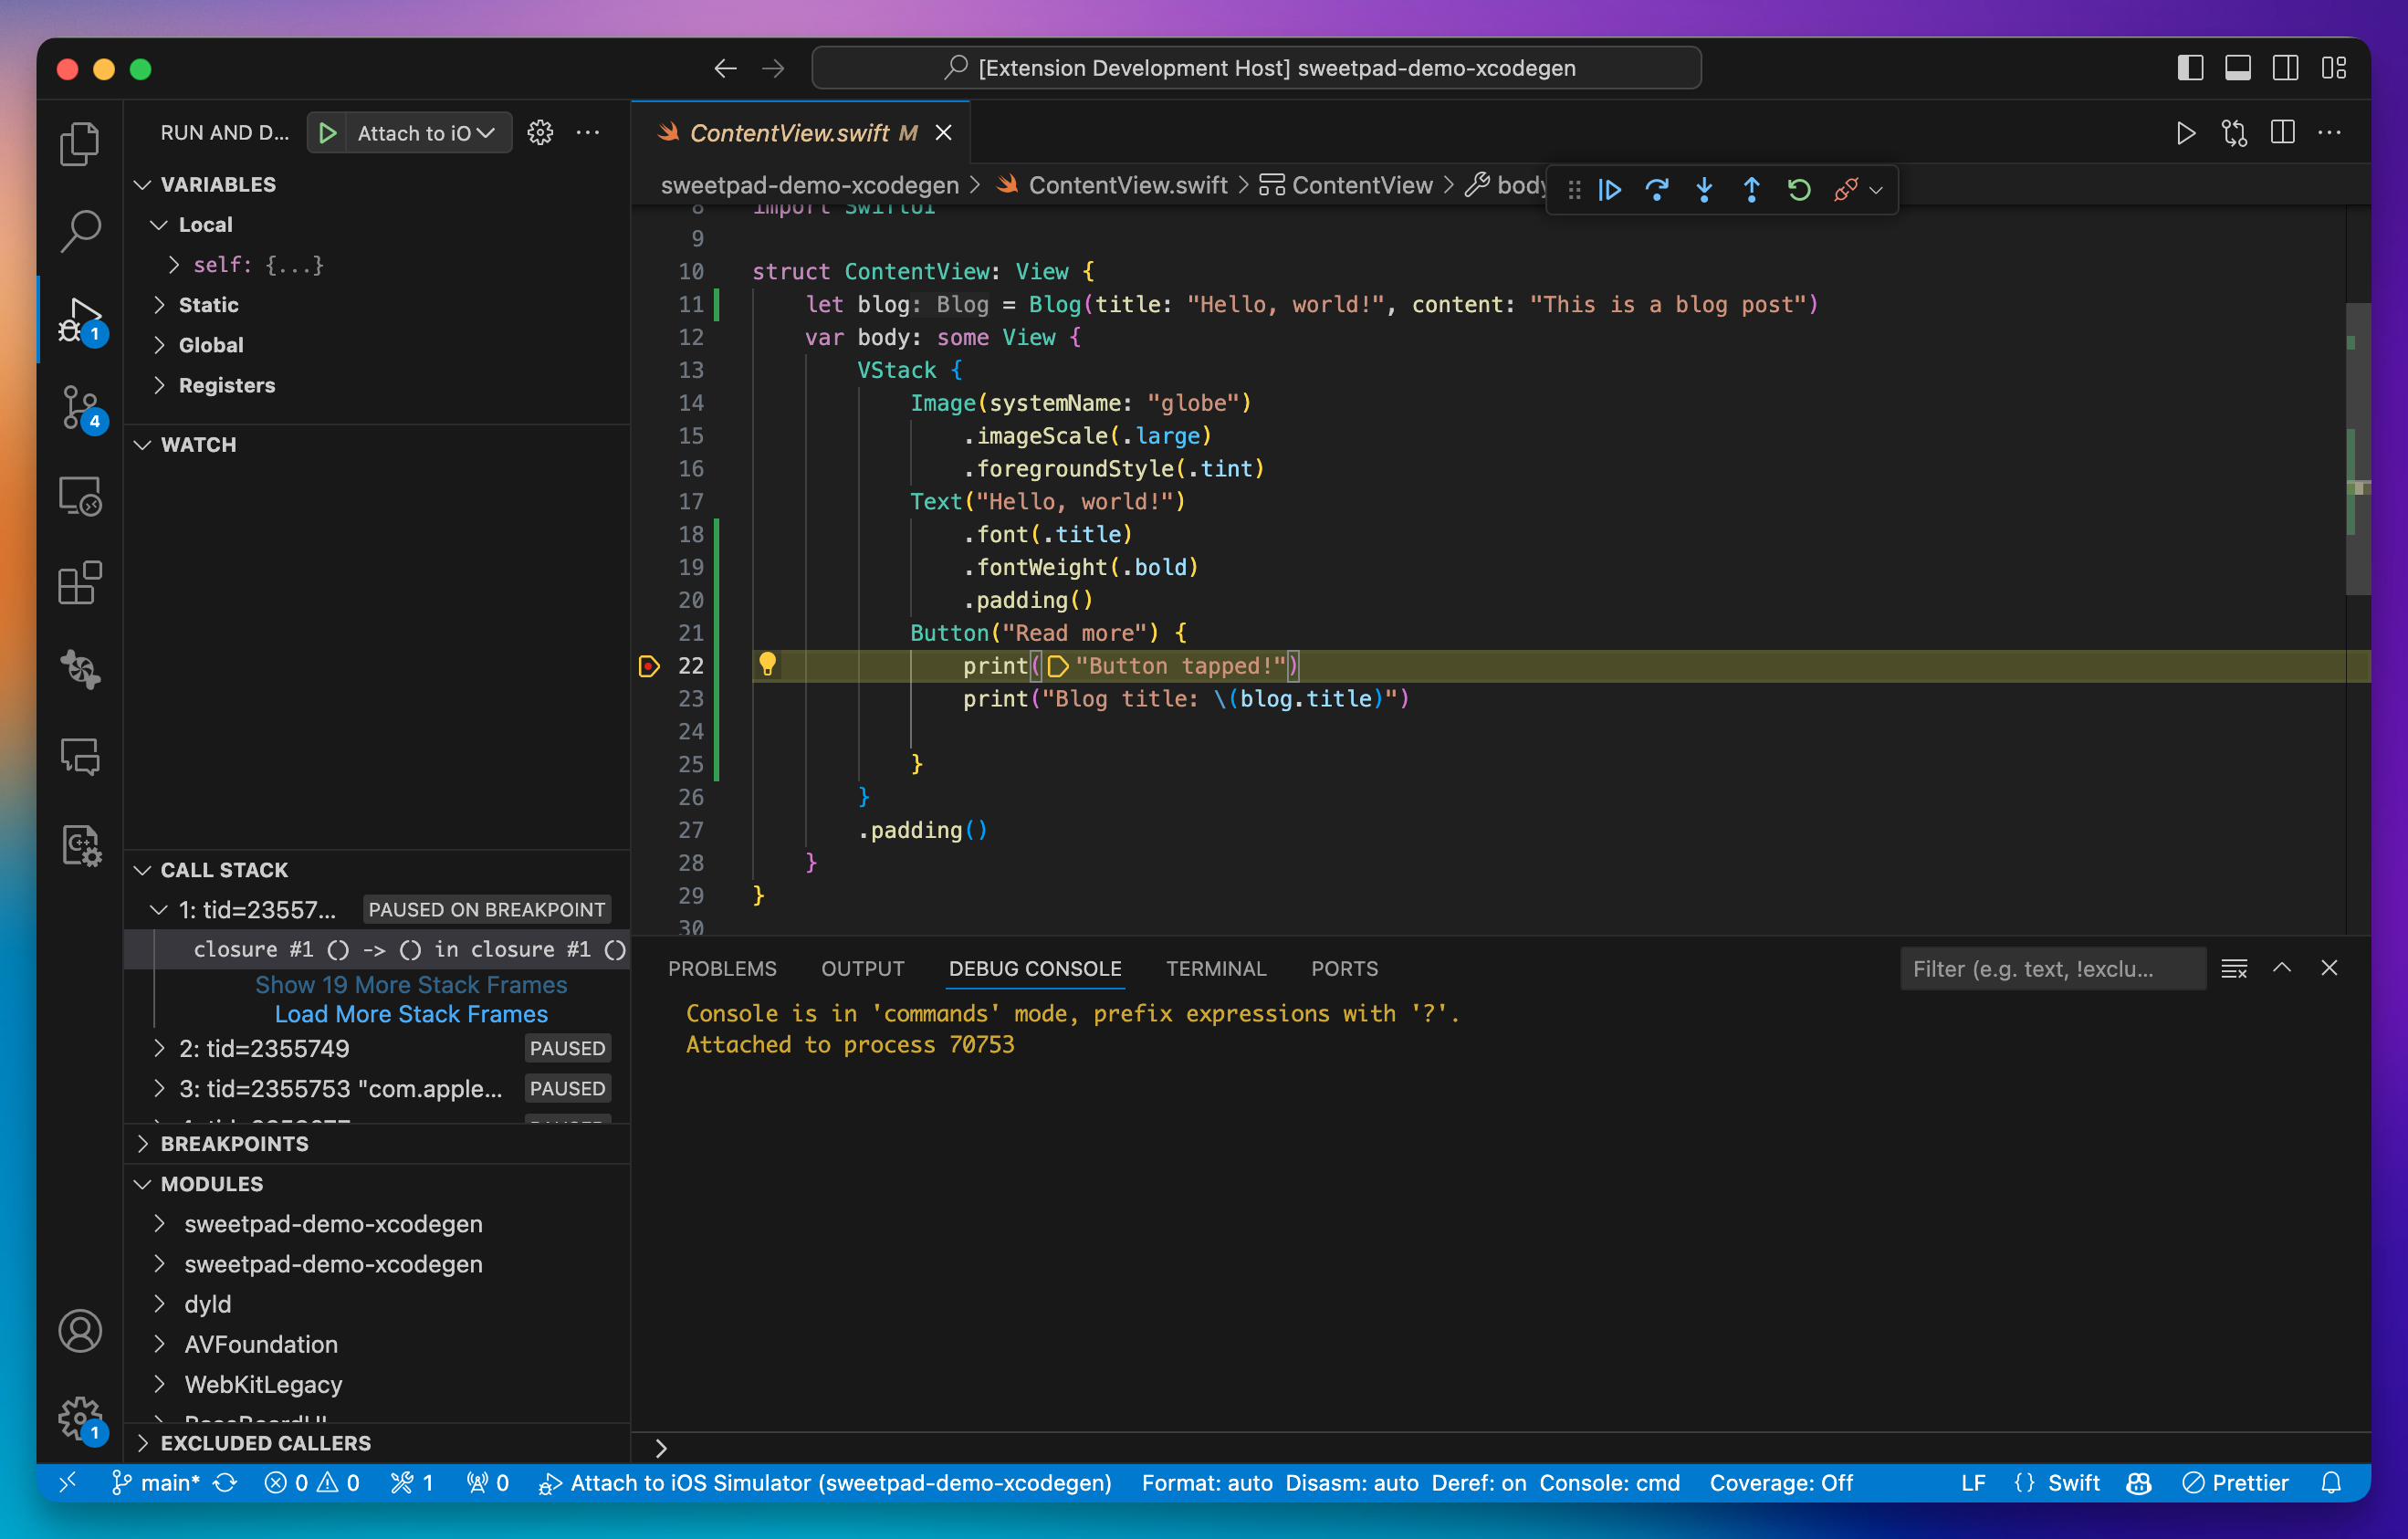
SweetPad debugs your app from VS Code through one of two debuggers. When the
SweetPad CLI is installed, it uses sweetpad dap, which drives Xcode's own lldb-dap and
needs no setup. Otherwise it uses the CodeLLDB
extension. Choosing the debugger explains how SweetPad picks one.
Tutorial
-
Create
launch.json.
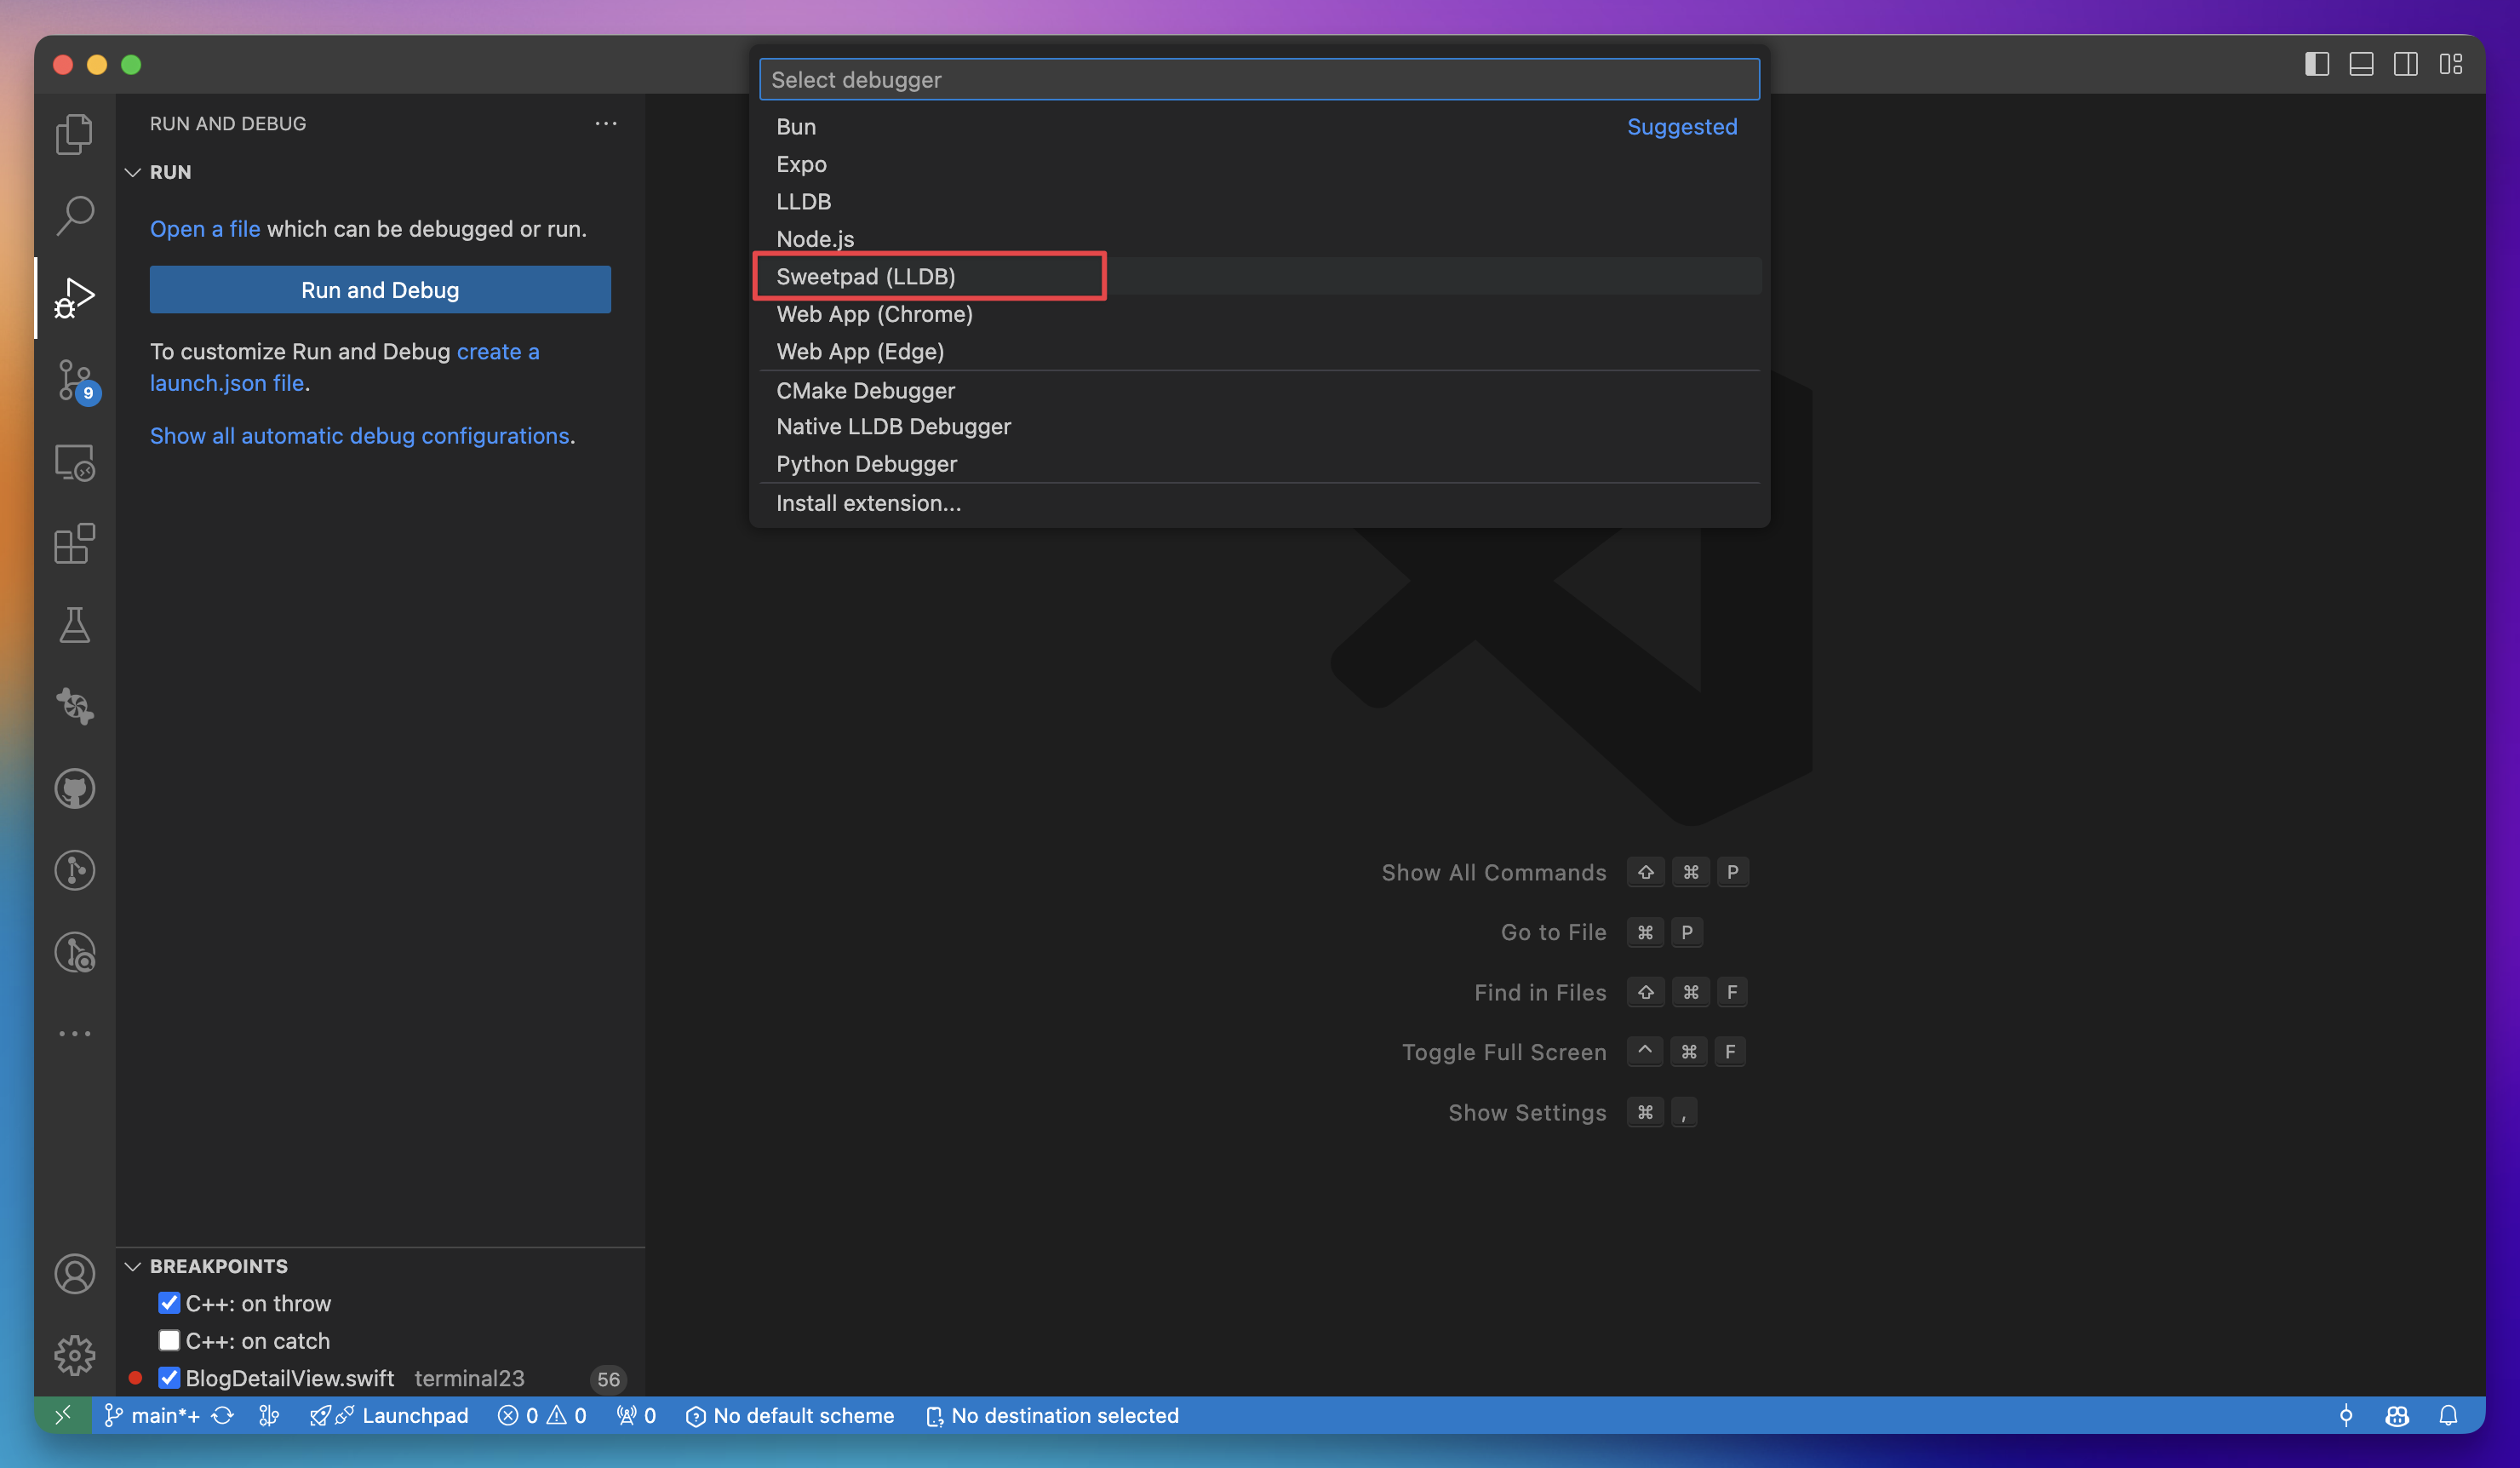
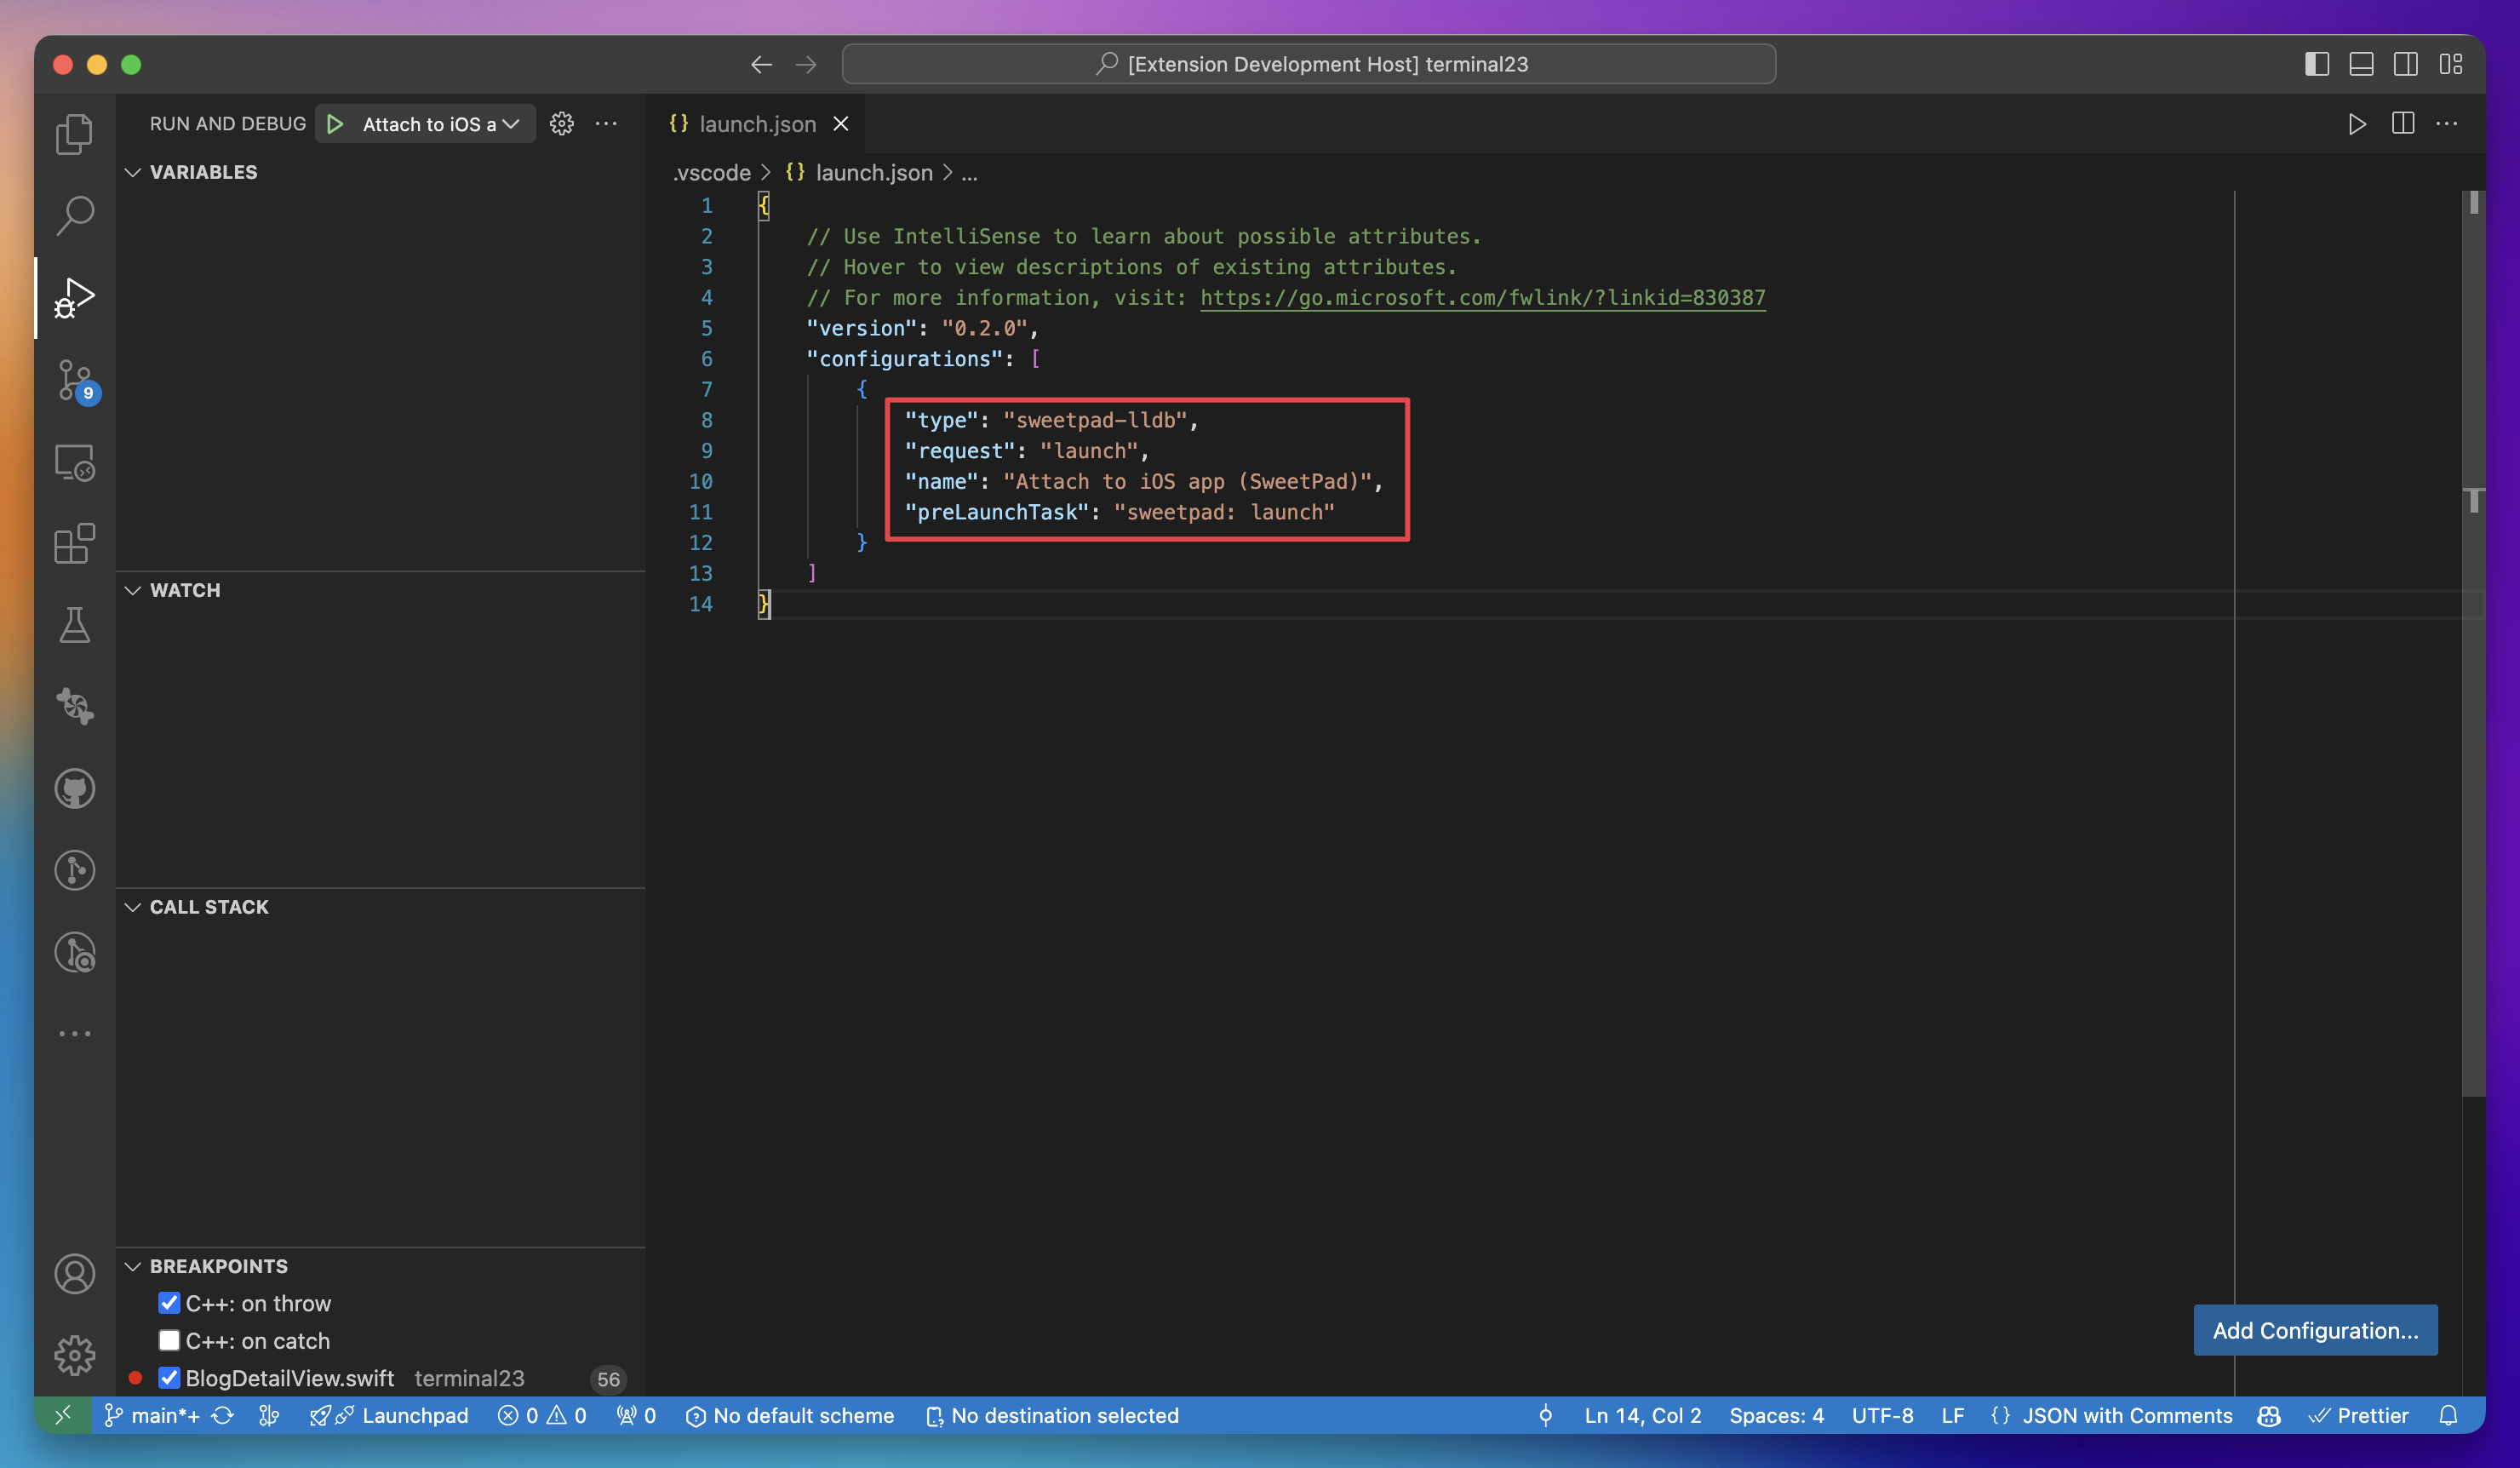
In the.vscodefolder of your project, create alaunch.jsonfile with the following content:.vscode/launch.json{"version": "0.2.0","configurations": [{"type": "sweetpad-lldb","request": "launch","name": "SweetPad: Build and Run"}]}You can also generate this file by clicking Create a launch.json file in the Run and Debug panel. Older configurations with
"request": "attach"and"preLaunchTask": "sweetpad: debugging-launch"keep working.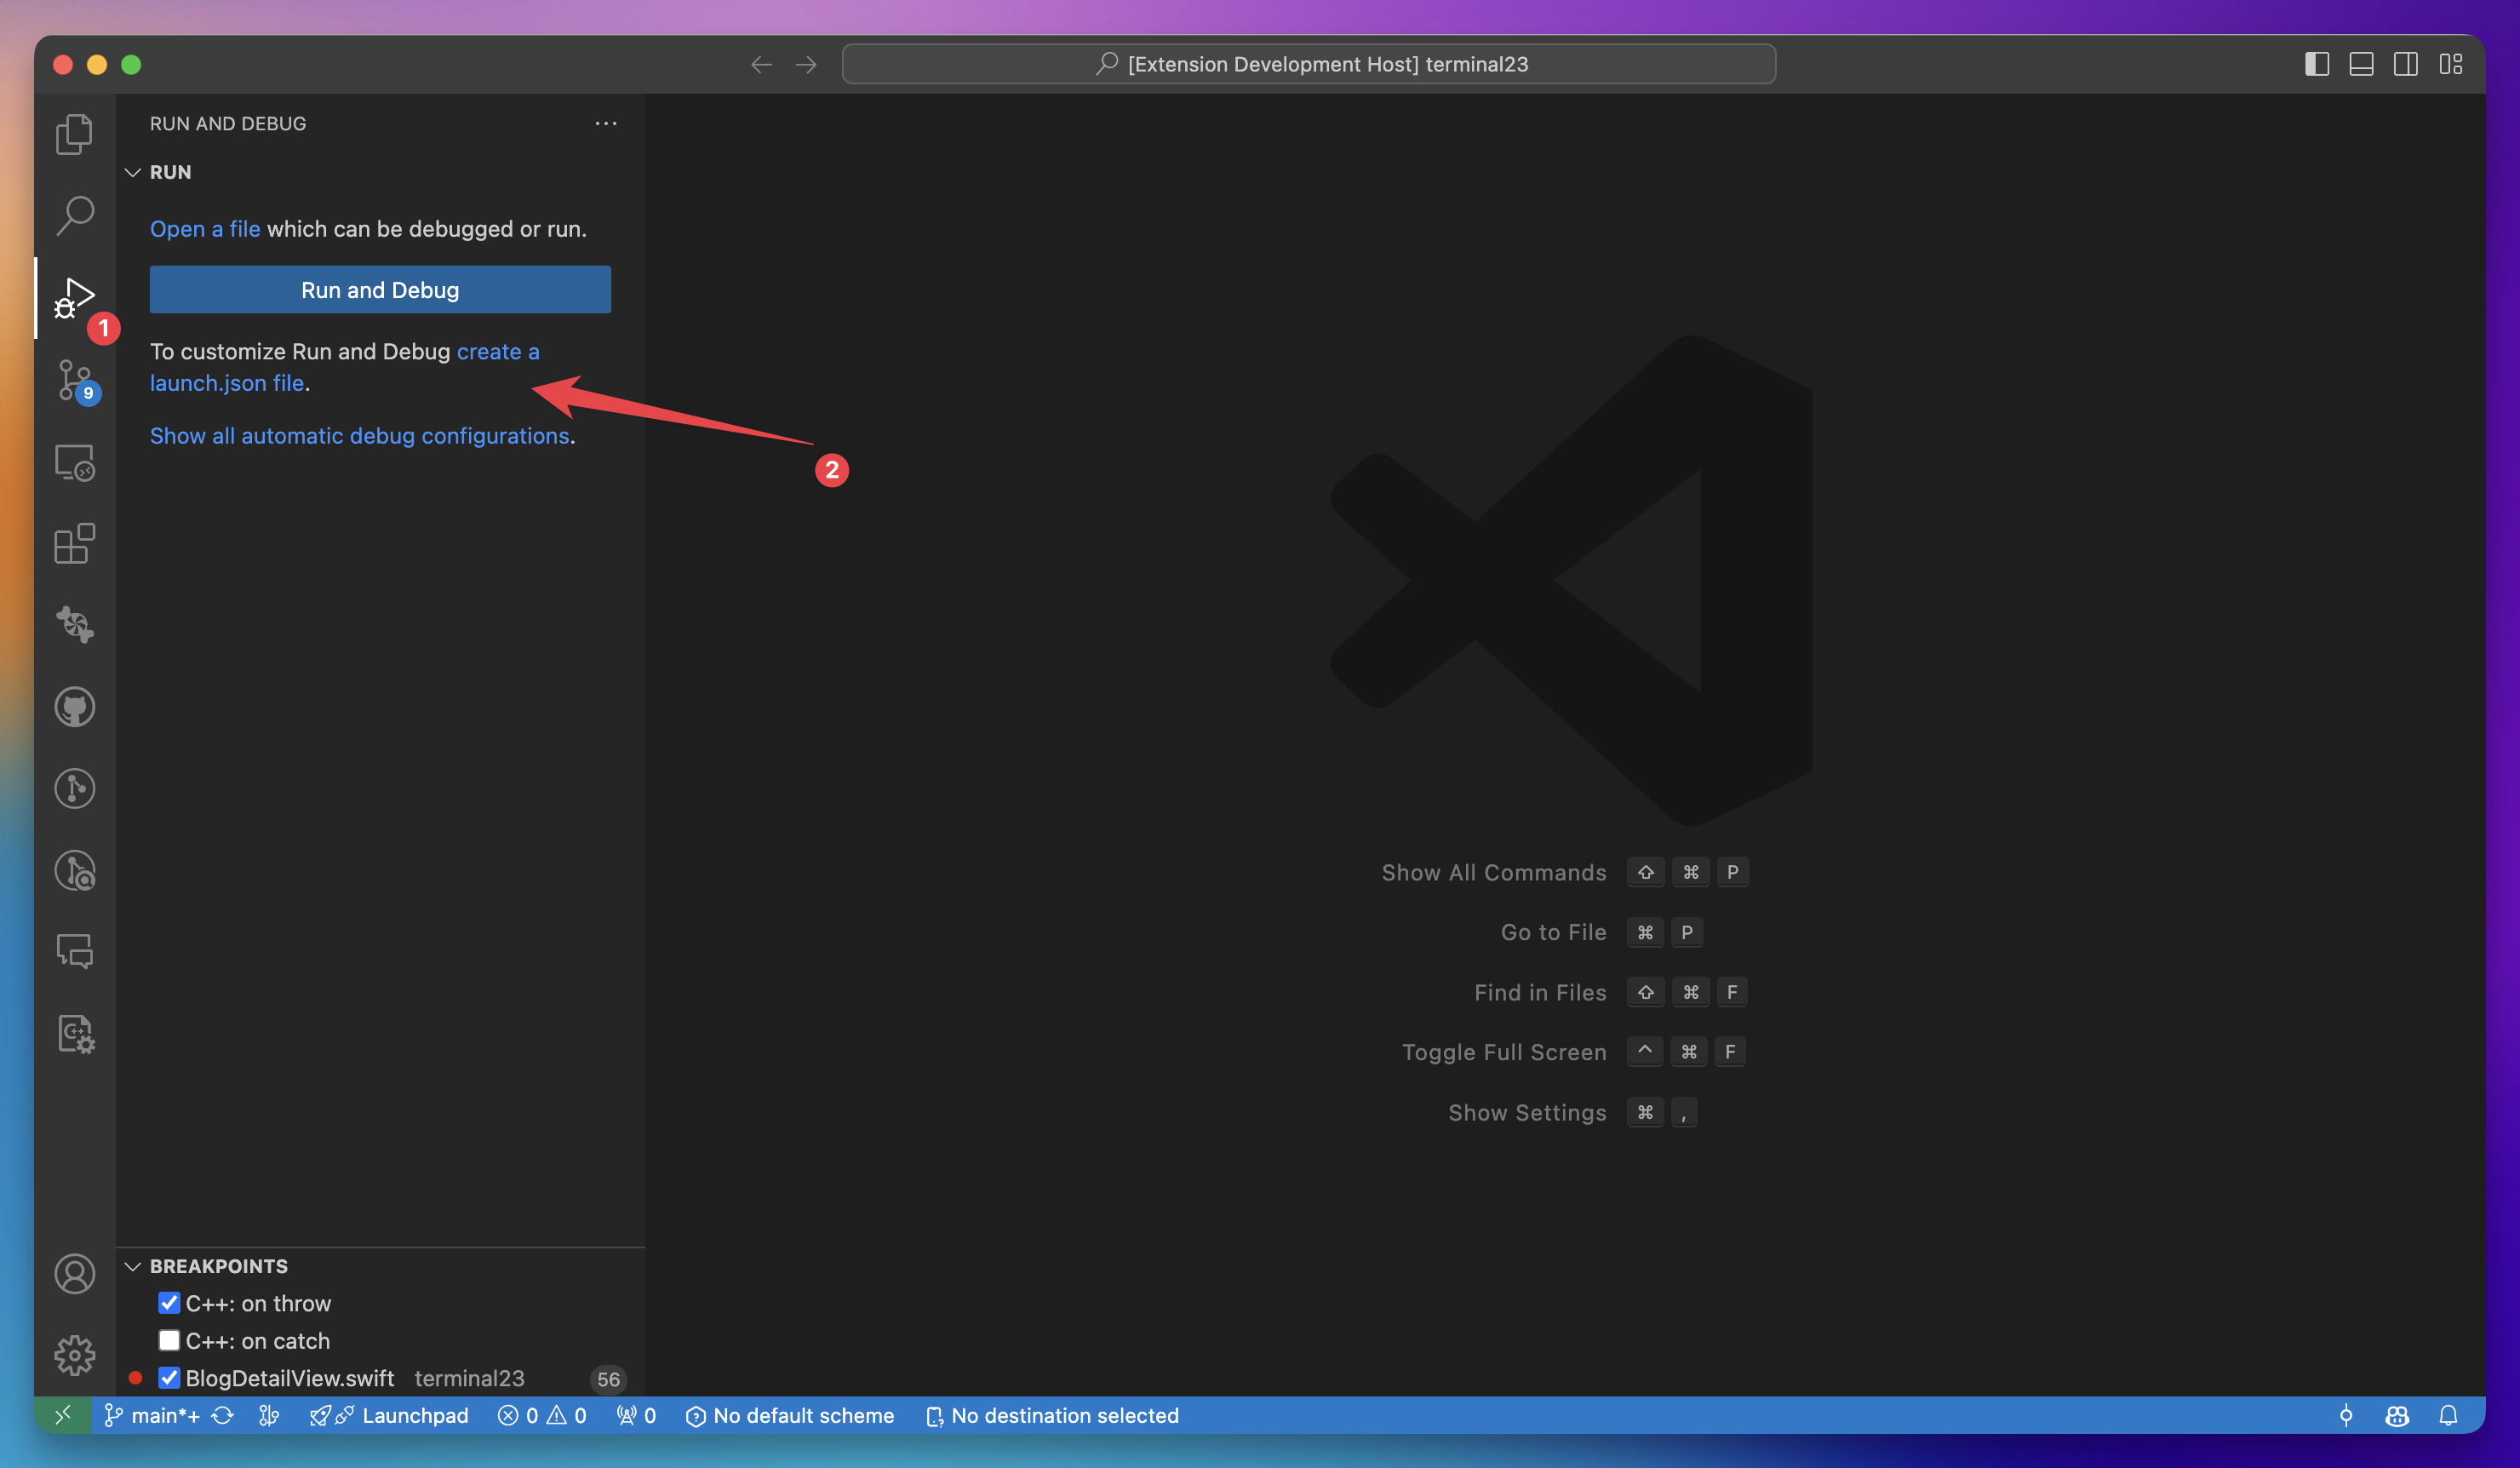
-
Using CodeLLDB? Configure its LLDB backend. Skip this step when the SweetPad CLI is installed. Otherwise point CodeLLDB at Xcode's bundled LLDB by adding the following to your
settings.json:settings.json{"lldb.library": "/Applications/Xcode.app/Contents/SharedFrameworks/LLDB.framework/Versions/A/LLDB"}That's the default path for a stock Xcode install. Adjust it if your Xcode lives somewhere else.
Alternatively, run LLDB: Use Alternate Backend from the command palette and type "lldb" to let CodeLLDB locate the library for you.
-
Start debugging (
F5).
Press F5. SweetPad builds the app, launches it in the Simulator, and attaches LLDB to the running process.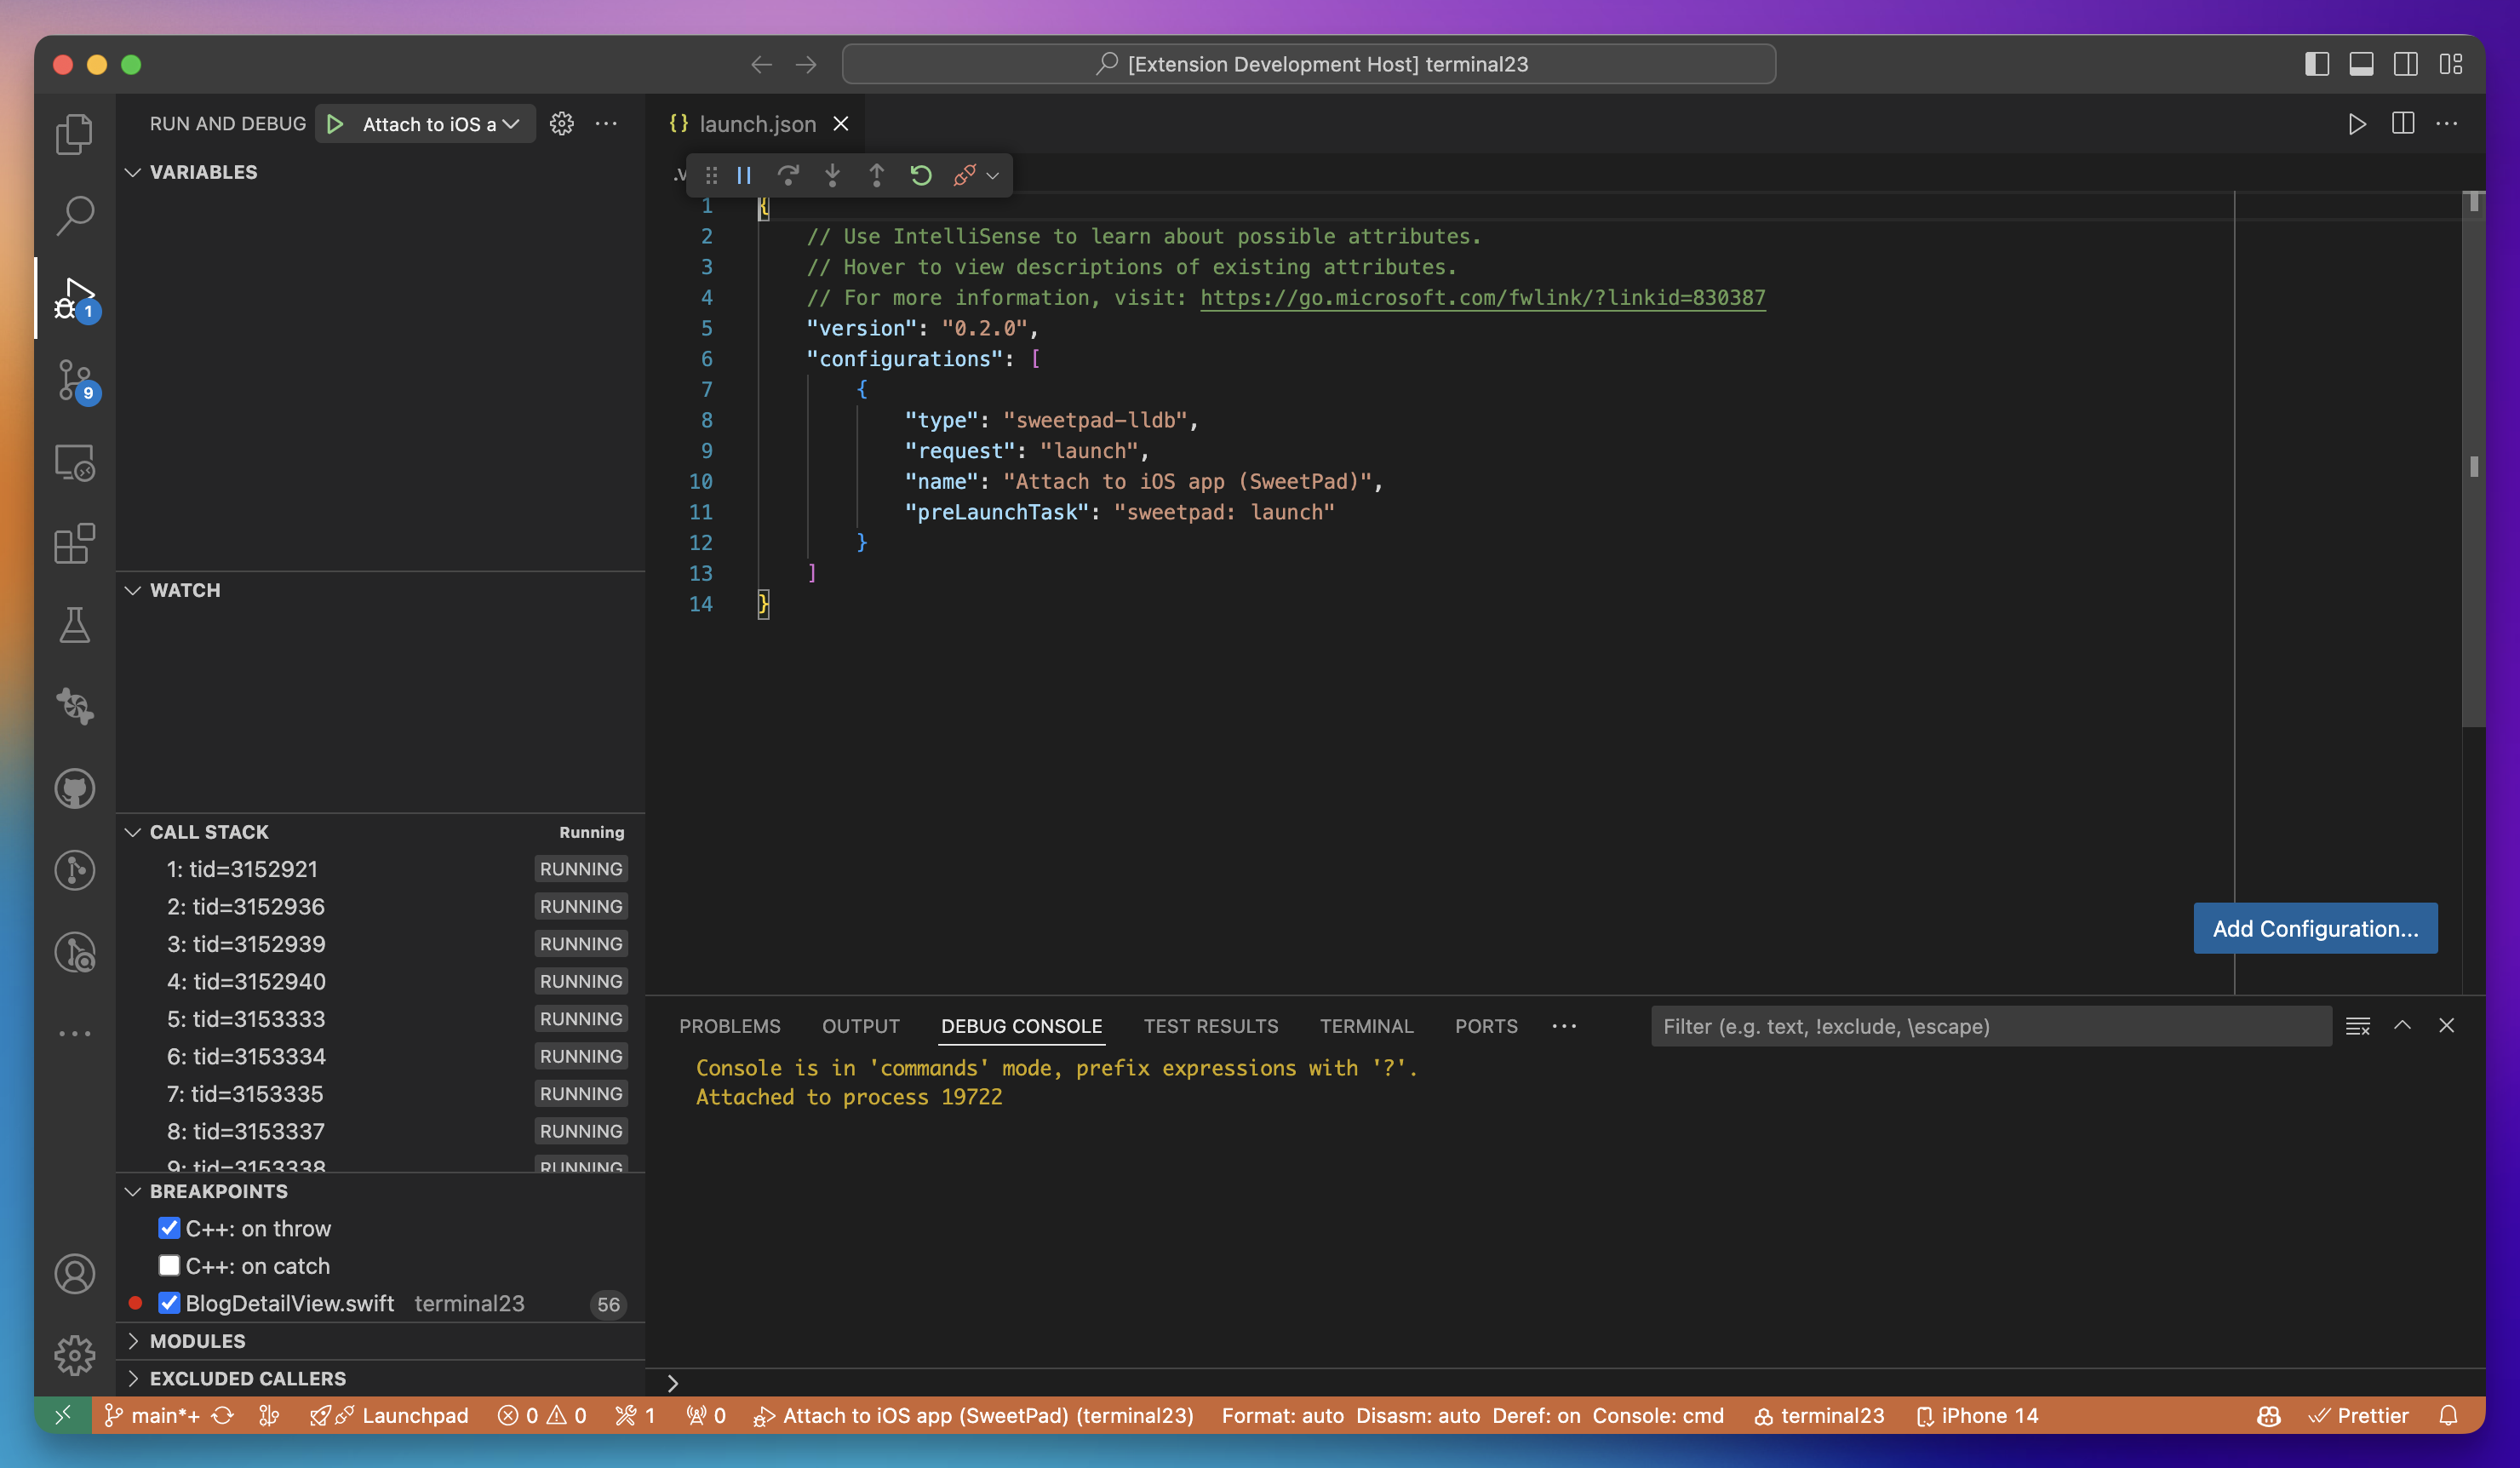
-
Set breakpoints and iterate.
Place breakpoints and debug as usual. On subsequent runs, just press F5 again. SweetPad rebuilds, relaunches, and reattaches.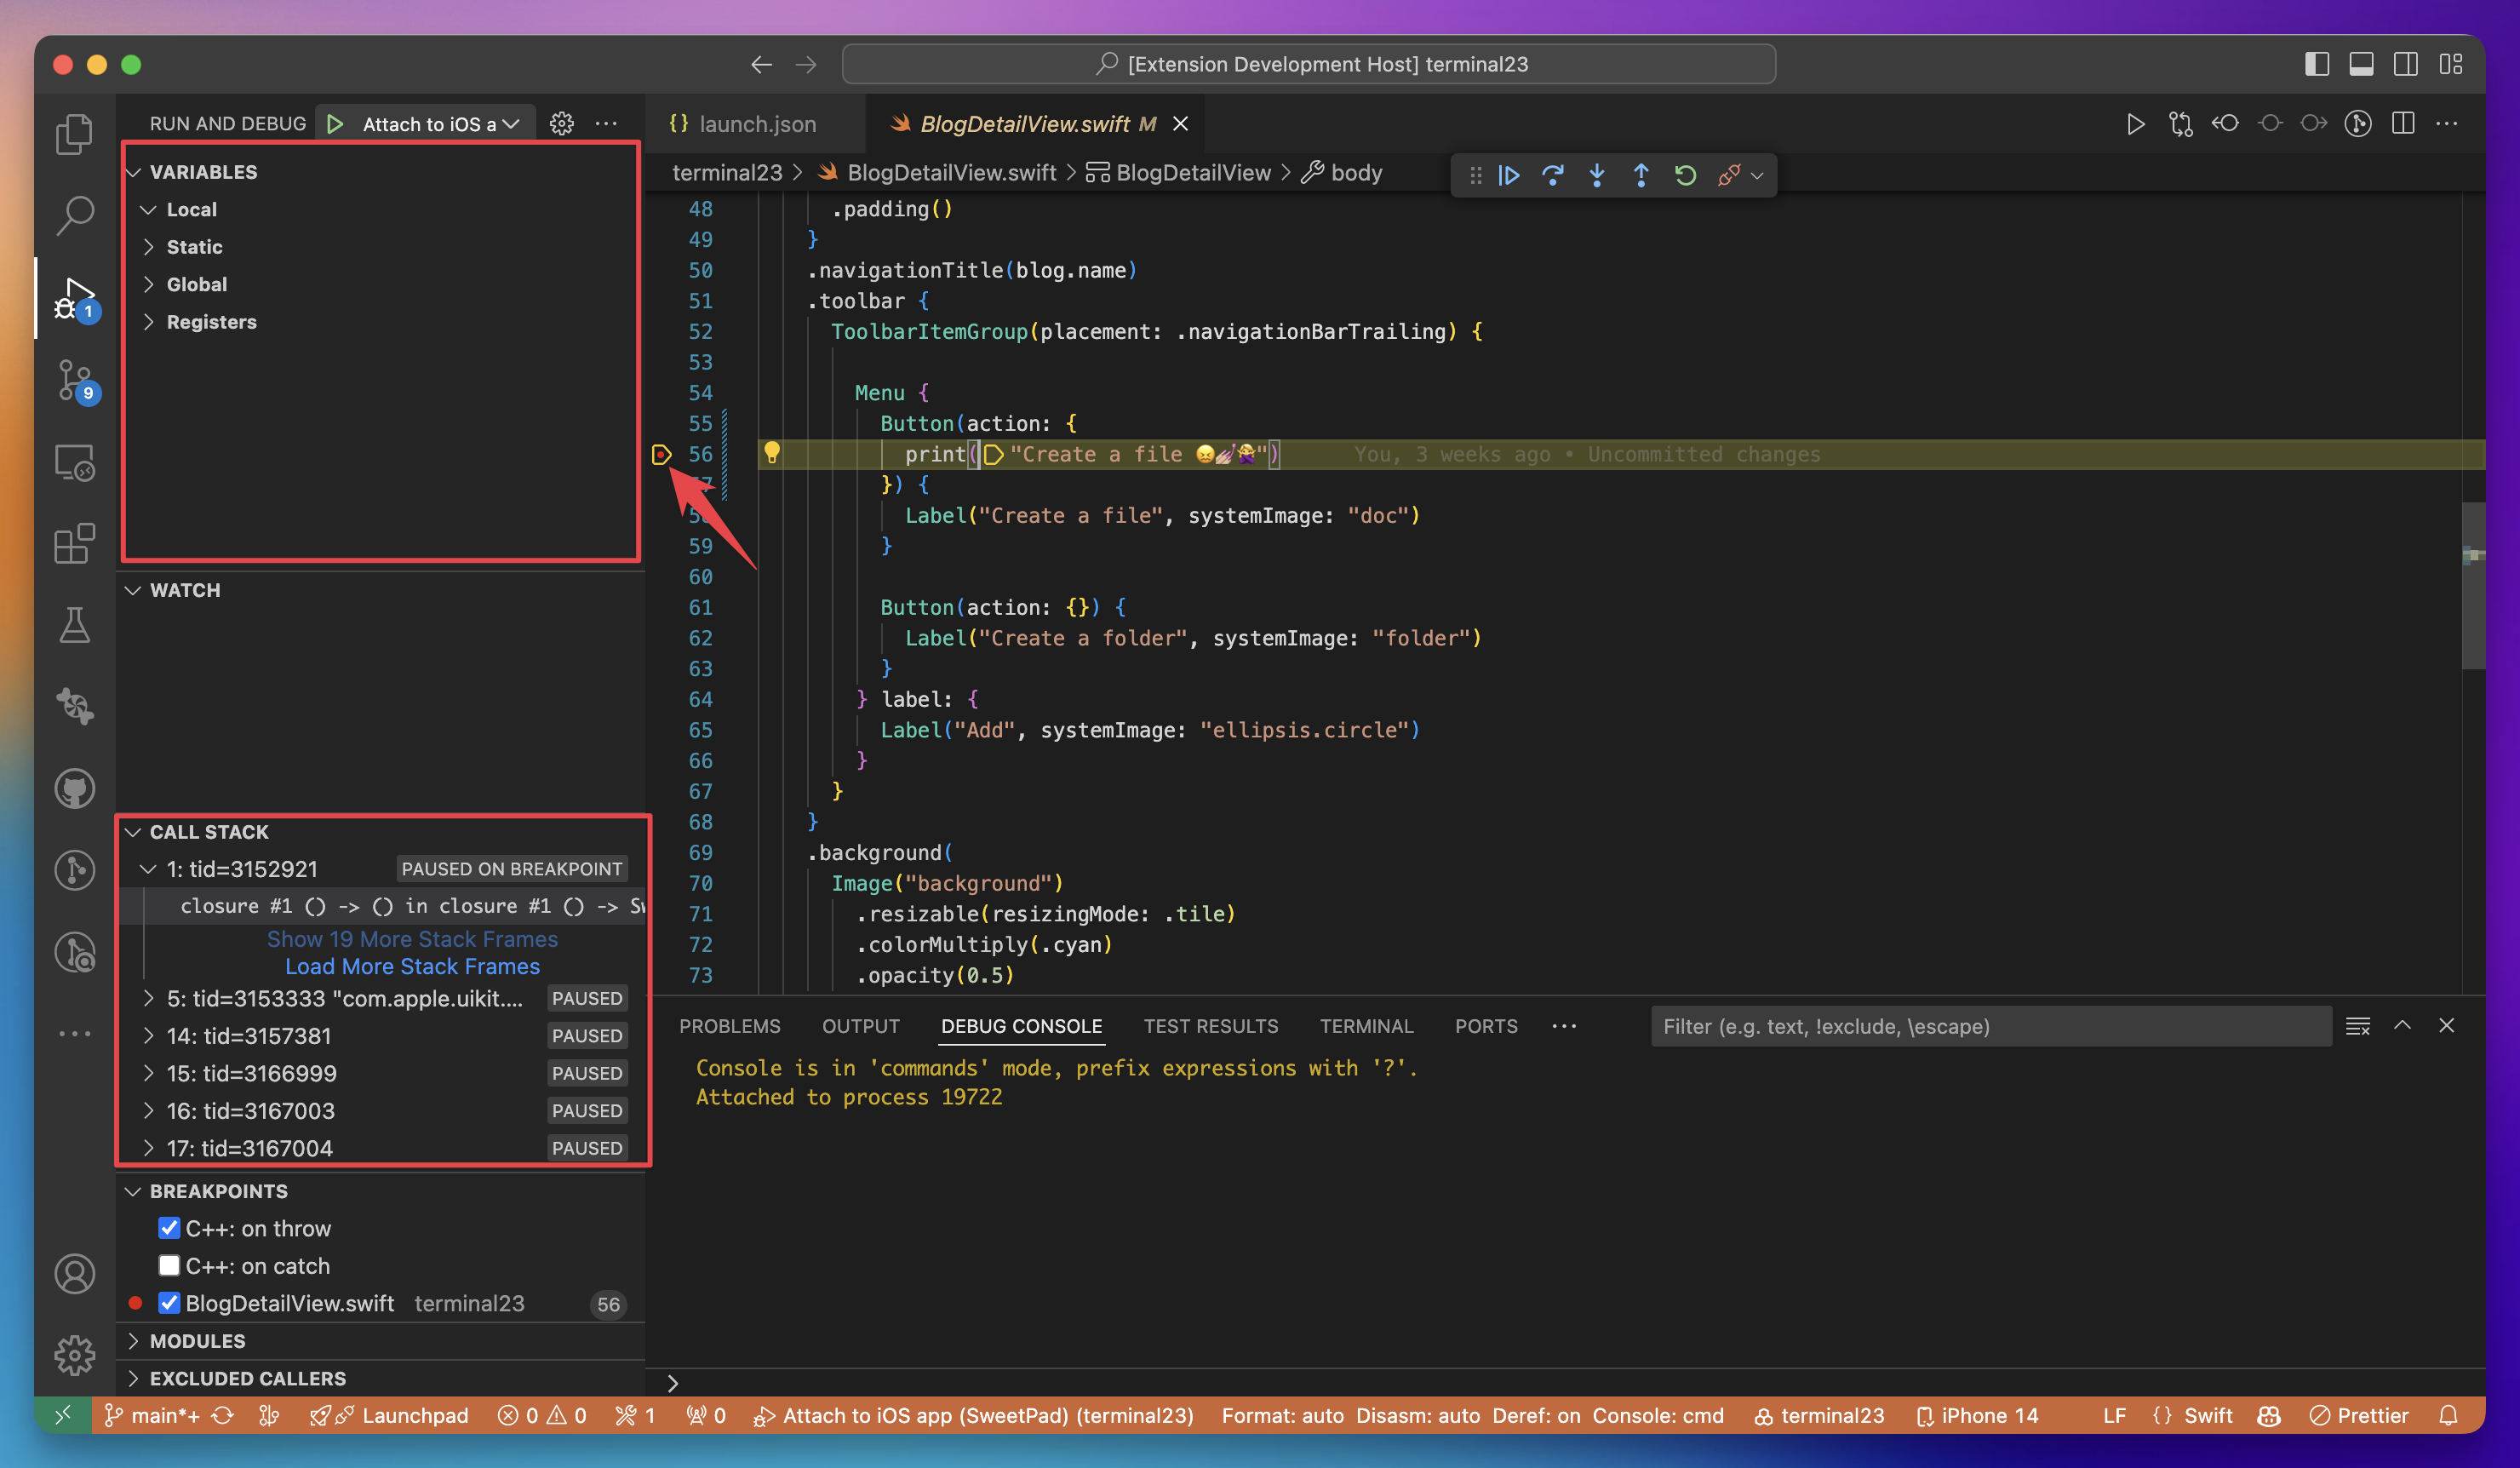
Choosing the debugger
The sweetpad.debugger.adapter setting decides which debugger runs a session:
auto(the default) uses the SweetPad CLI when it's installed and hassweetpad dap, and CodeLLDB otherwise. Devices on iOS 16 and older always use CodeLLDB, since the CLI reaches devices throughdevicectl.sweetpadalways uses the CLI.codelldbalways uses CodeLLDB.
With neither installed, starting a session says so and offers to install one. SweetPad looks for the CLI on your
PATH, then in /opt/homebrew/bin and /usr/local/bin; sweetpad.debugger.cliPath names it explicitly.
On the CLI route, the build output and app logs appear in the Debug Console, errors link to their source line, and
stopping the session during the build cancels it. The scheme, configuration and destination are the ones selected in
SweetPad; scheme, configuration, destination, args and env in launch.json override them. A lldb object is
passed to lldb-dap as it is, for example "lldb": { "initCommands": ["..."] }.
Editor debugging lists every field.
Customize preLaunchTask
If you need more control, you can point the preLaunchTask property to a custom task defined in .vscode/tasks.json.
For example, the task below builds the app with the Release scheme before launching the debugger:
{
  "version": "2.0.0",
  "tasks": [
    {
      "type": "sweetpad",
      "action": "launch",
      "label": "sweetpad: launch release",
      "detail": "Build and launch the app (Release)",
      "scheme": "Release",
      "configuration": "Release",
      "isBackground": true, // Important: lets VSCode know when the task is ready
      "problemMatcher": ["$sweetpad-watch"]
    }
  ]
}
Then reference that task from launch.json:
{
  "version": "0.2.0",
  "configurations": [
    {
      "type": "sweetpad-lldb",
      "request": "attach",
      "name": "Attach to running app (SweetPad – Release)",
      "preLaunchTask": "sweetpad: launch release"
    }
  ]
}
Passing CodeLLDB parameters
On the CodeLLDB route, to pass additional parameters to CodeLLDB, use the codelldbAttributes property in your launch.json file. For
example, if you want to execute LLDB commands before the debugger starts, you can do it like this:
{
  "version": "0.2.0",
  "configurations": [
    {
      "type": "sweetpad-lldb",
      "request": "attach",
      "name": "Attach to running app (SweetPad)",
      "preLaunchTask": "sweetpad: launch",
      "codelldbAttributes": {
        "initCommands": [
          // This command will be executed before the debugger starts
          "script print('Hello from LLDB!')"
        ]
      }
    }
  ]
}
The full list of available parameters for codelldbAttributes can be found in the
CodeLLDB documentation.
Debugging on a physical device
This section is only relevant if you're debugging an app running on a physical device. Debugging on a device should
generally work out of the box, but there are some differences compared to the simulator that you should be aware of.
On iOS 17+ the device launch goes through a developer tunnel managed by pymobiledevice3; see
Devices → iOS 17+: the developer tunnel for the one-time setup.
Merging codelldbAttributes
When attaching to an app running on a physical device, SweetPad injects its own LLDB commands into
initCommands, preRunCommands, and processCreateCommands. If you supply your own commands through
codelldbAttributes, SweetPad merges them in this order:
{
  "codelldbAttributes": {
    "initCommands": [...yourCommands, ...sweetpadCommands],
    "preRunCommands": [...yourCommands, ...sweetpadCommands],
    "processCreateCommands": [...yourCommands, ...sweetpadCommands]
  }
}
SweetPad's injected commands take care of connecting to the device and finding the remote process. Your commands run first, so anything you set up (logging, breakpoint behavior) is in place before SweetPad's connection steps run.
Stop on attach
By default, SweetPad tells the debugger to continue running immediately after attaching, so you don't end up paused
on an arbitrary instruction with no breakpoints set. If you'd rather have the debugger stop on attach, add
"continueOnAttach": false to your configuration:
{
  "type": "sweetpad-lldb",
  "request": "attach",
  "name": "Attach to running app (SweetPad)",
  "preLaunchTask": "sweetpad: launch",
  "continueOnAttach": false,
  "codelldbAttributes": {}
}
Note that continueOnAttach is a SweetPad-specific attribute, not part of the CodeLLDB configuration.
Old tutorial (deprecated)
The following method is retained for backwards compatibility. It still works, but the flow above is the recommended one.
-
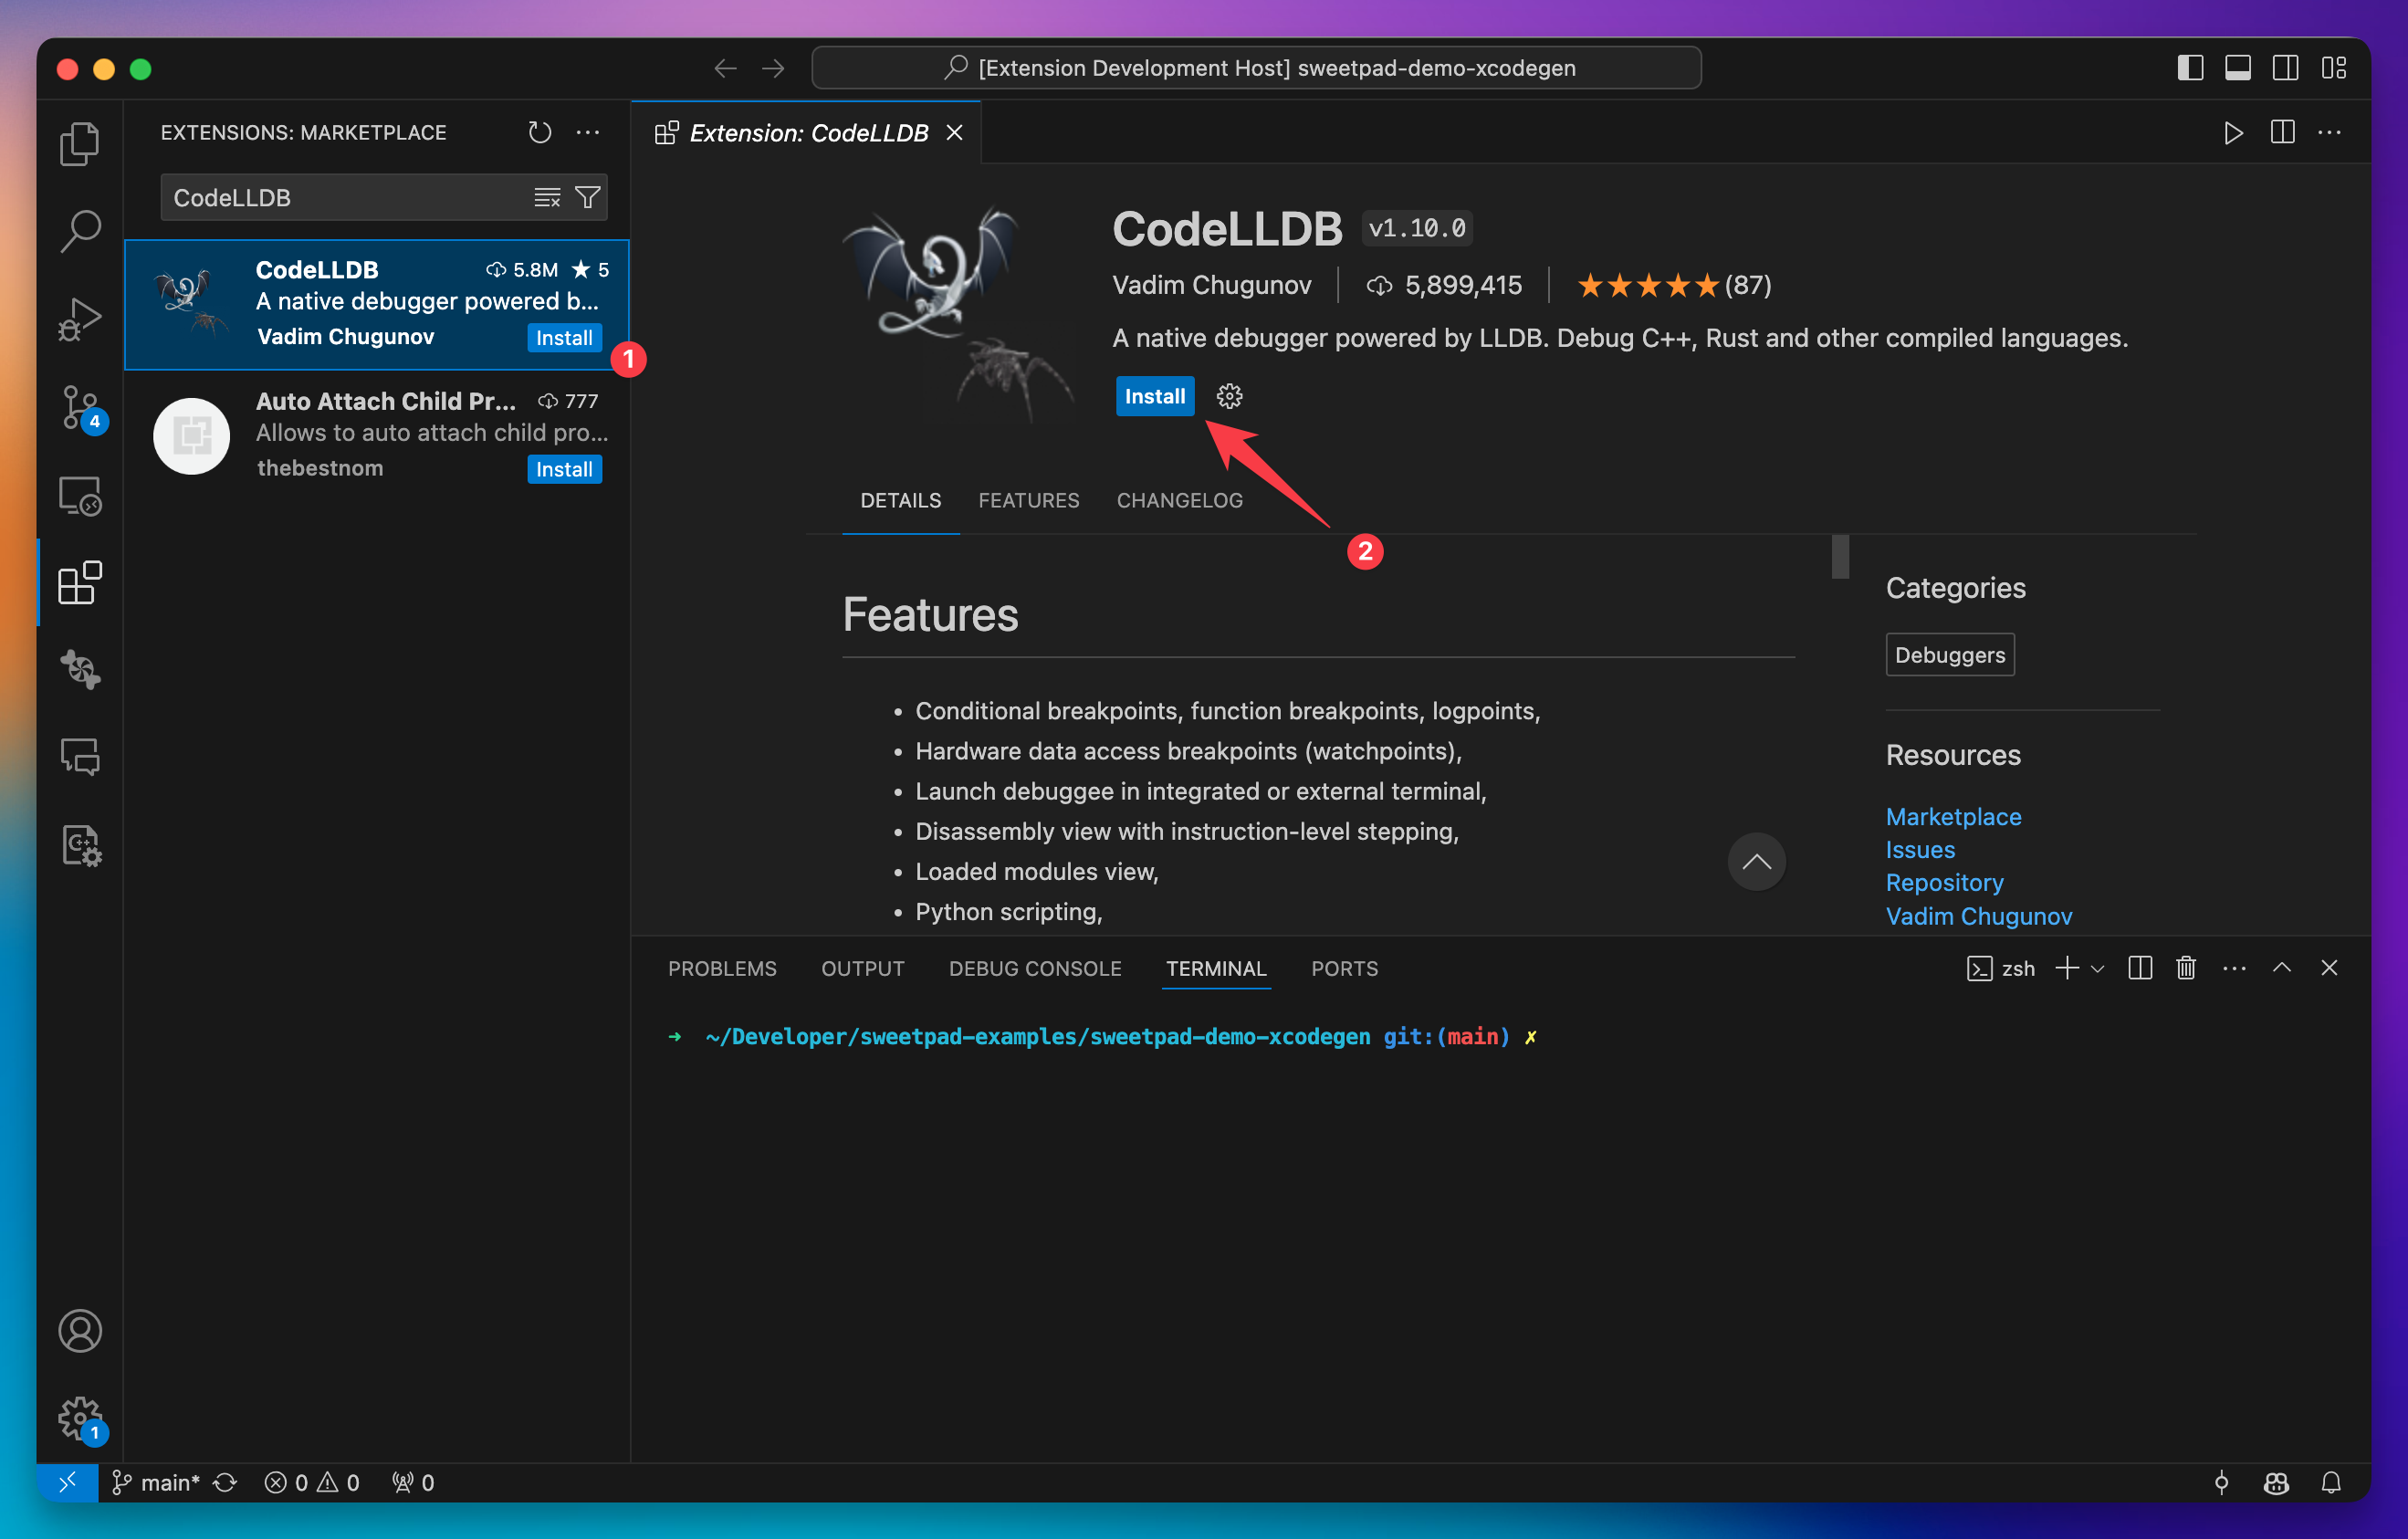
Install CodeLLDB. Install the CodeLLDB extension from the VSCode Marketplace.
-
Create
launch.json. Add the configuration below:.vscode/launch.json{"version": "0.2.0","configurations": [{"type": "lldb","request": "attach","name": "Attach to iOS Simulator","waitFor": true,"program": "${command:sweetpad.debugger.getAppPath}"}]}
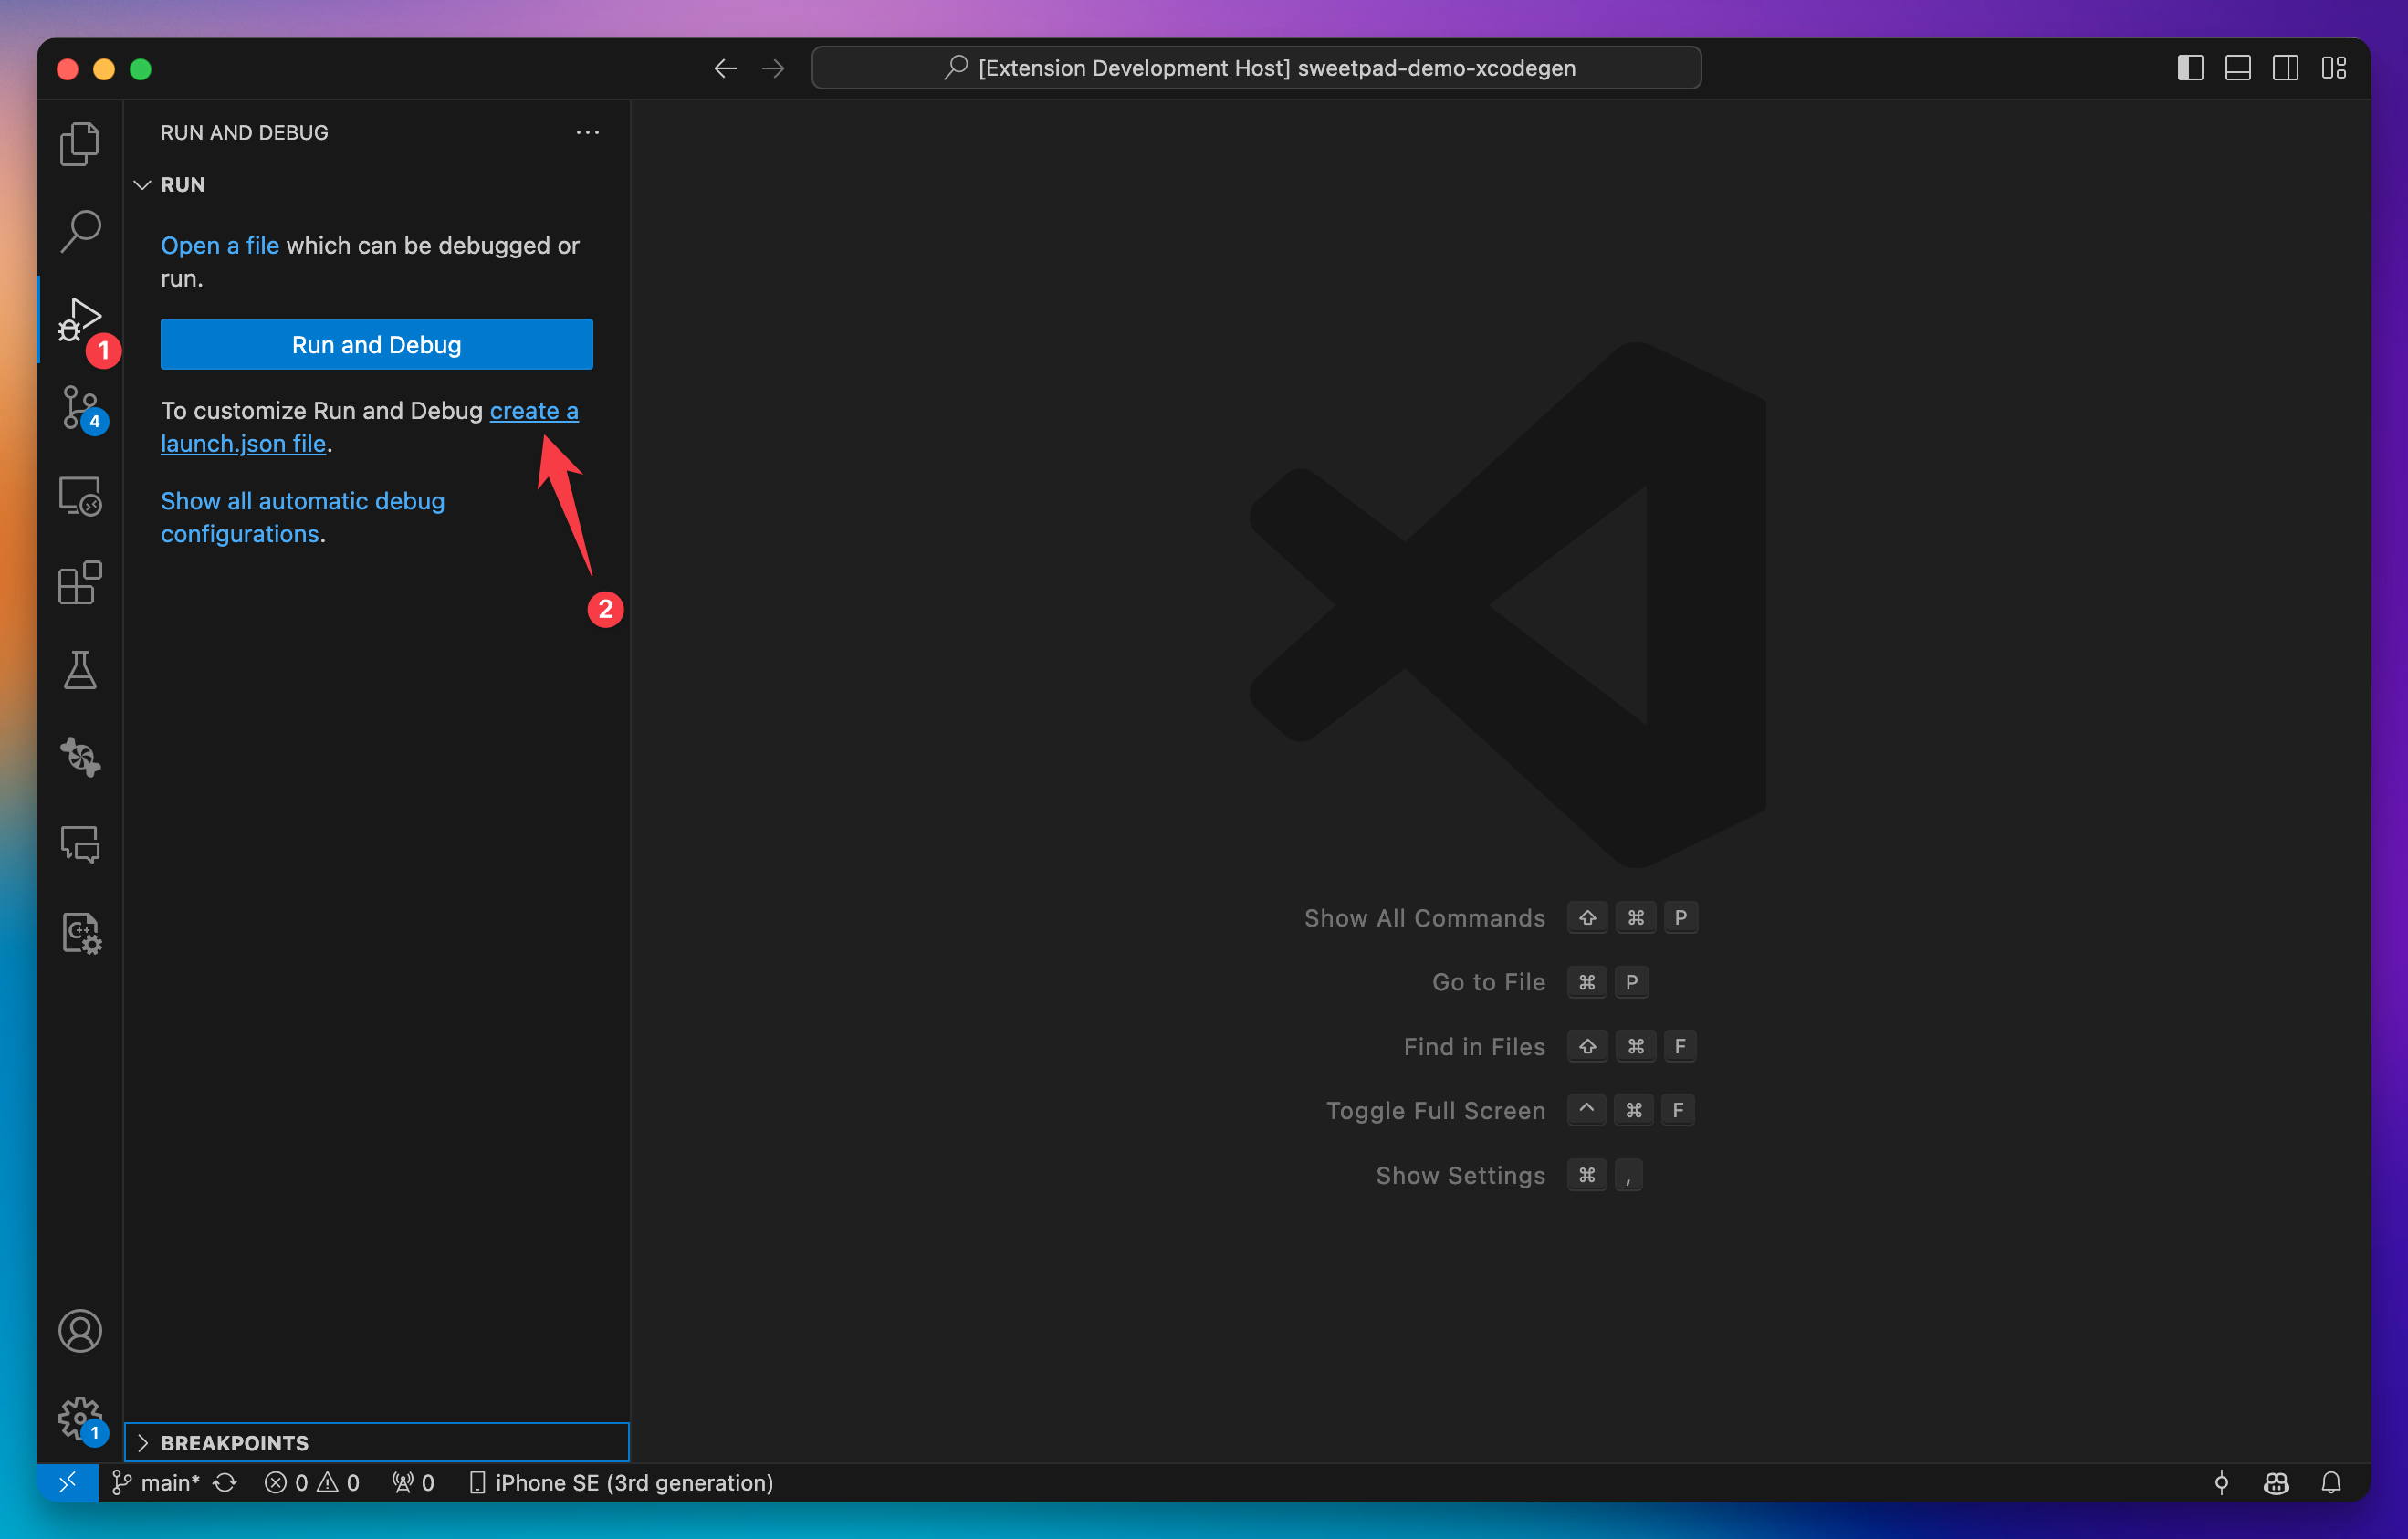
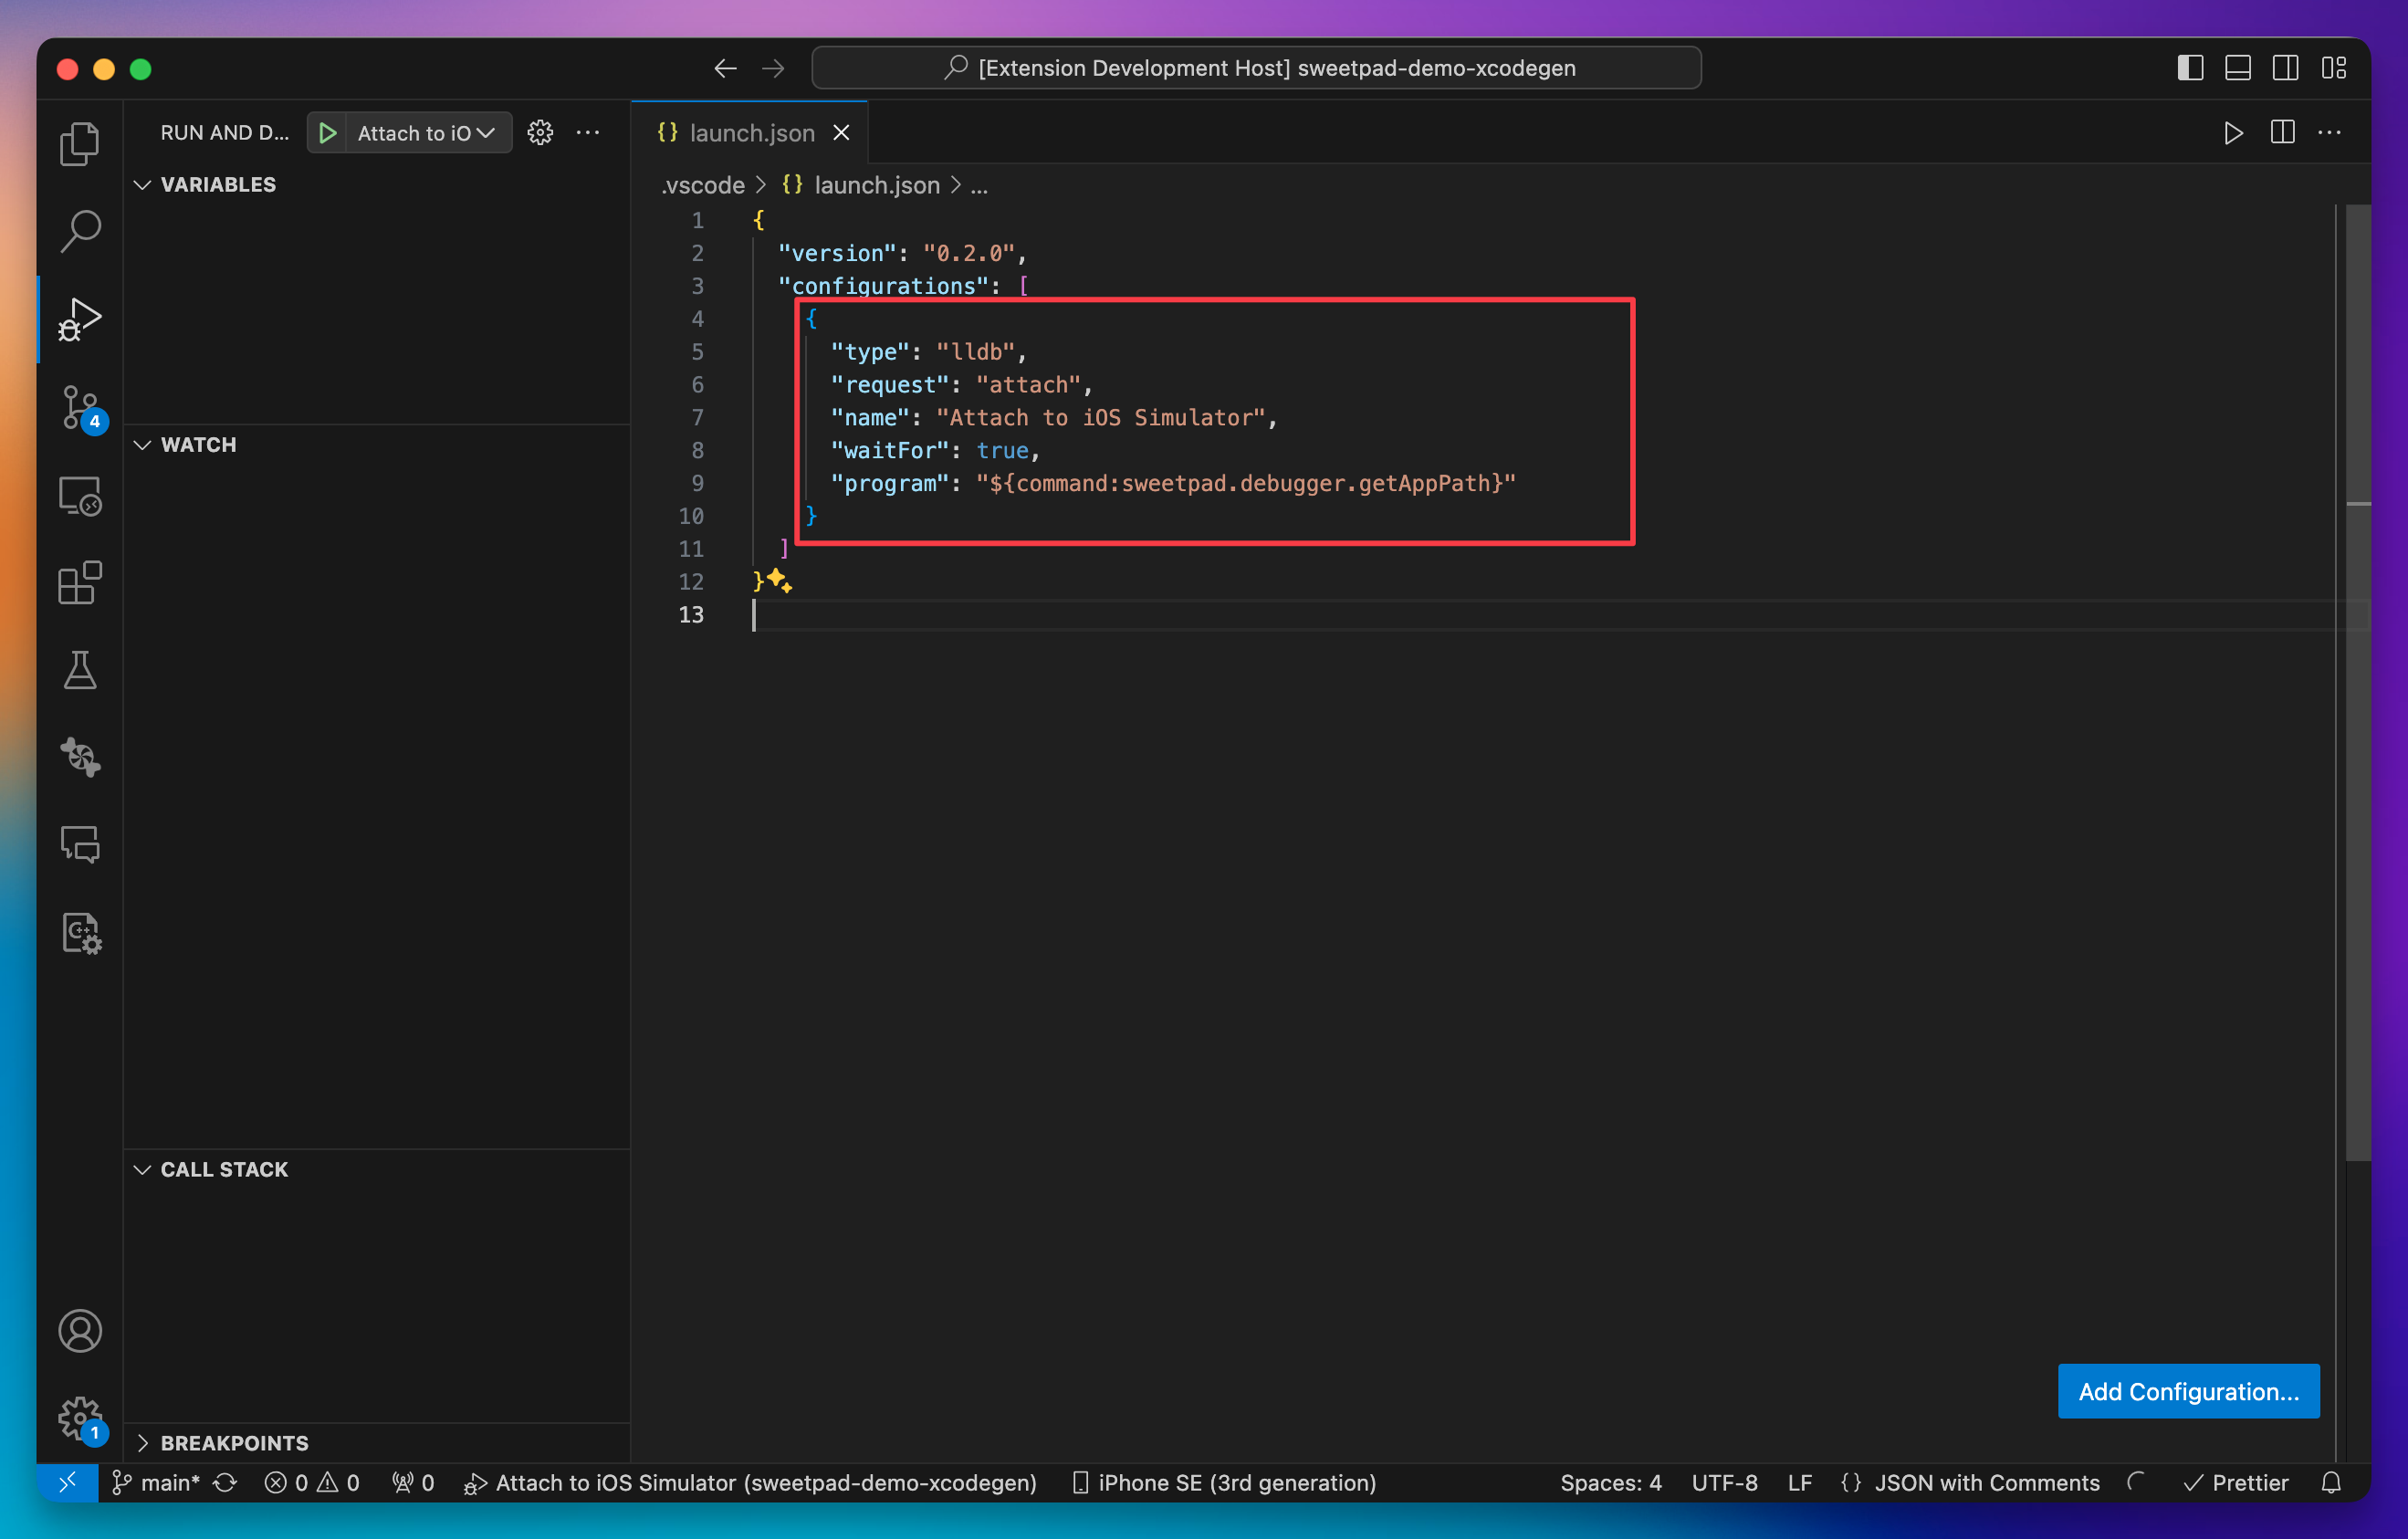
The ${command:sweetpad.debugger.getAppPath} variable resolves at runtime to the path of the app most recently built
by SweetPad, which CodeLLDB needs to attach to the simulator. See the
CodeLLDB manual for the full set of options.
-
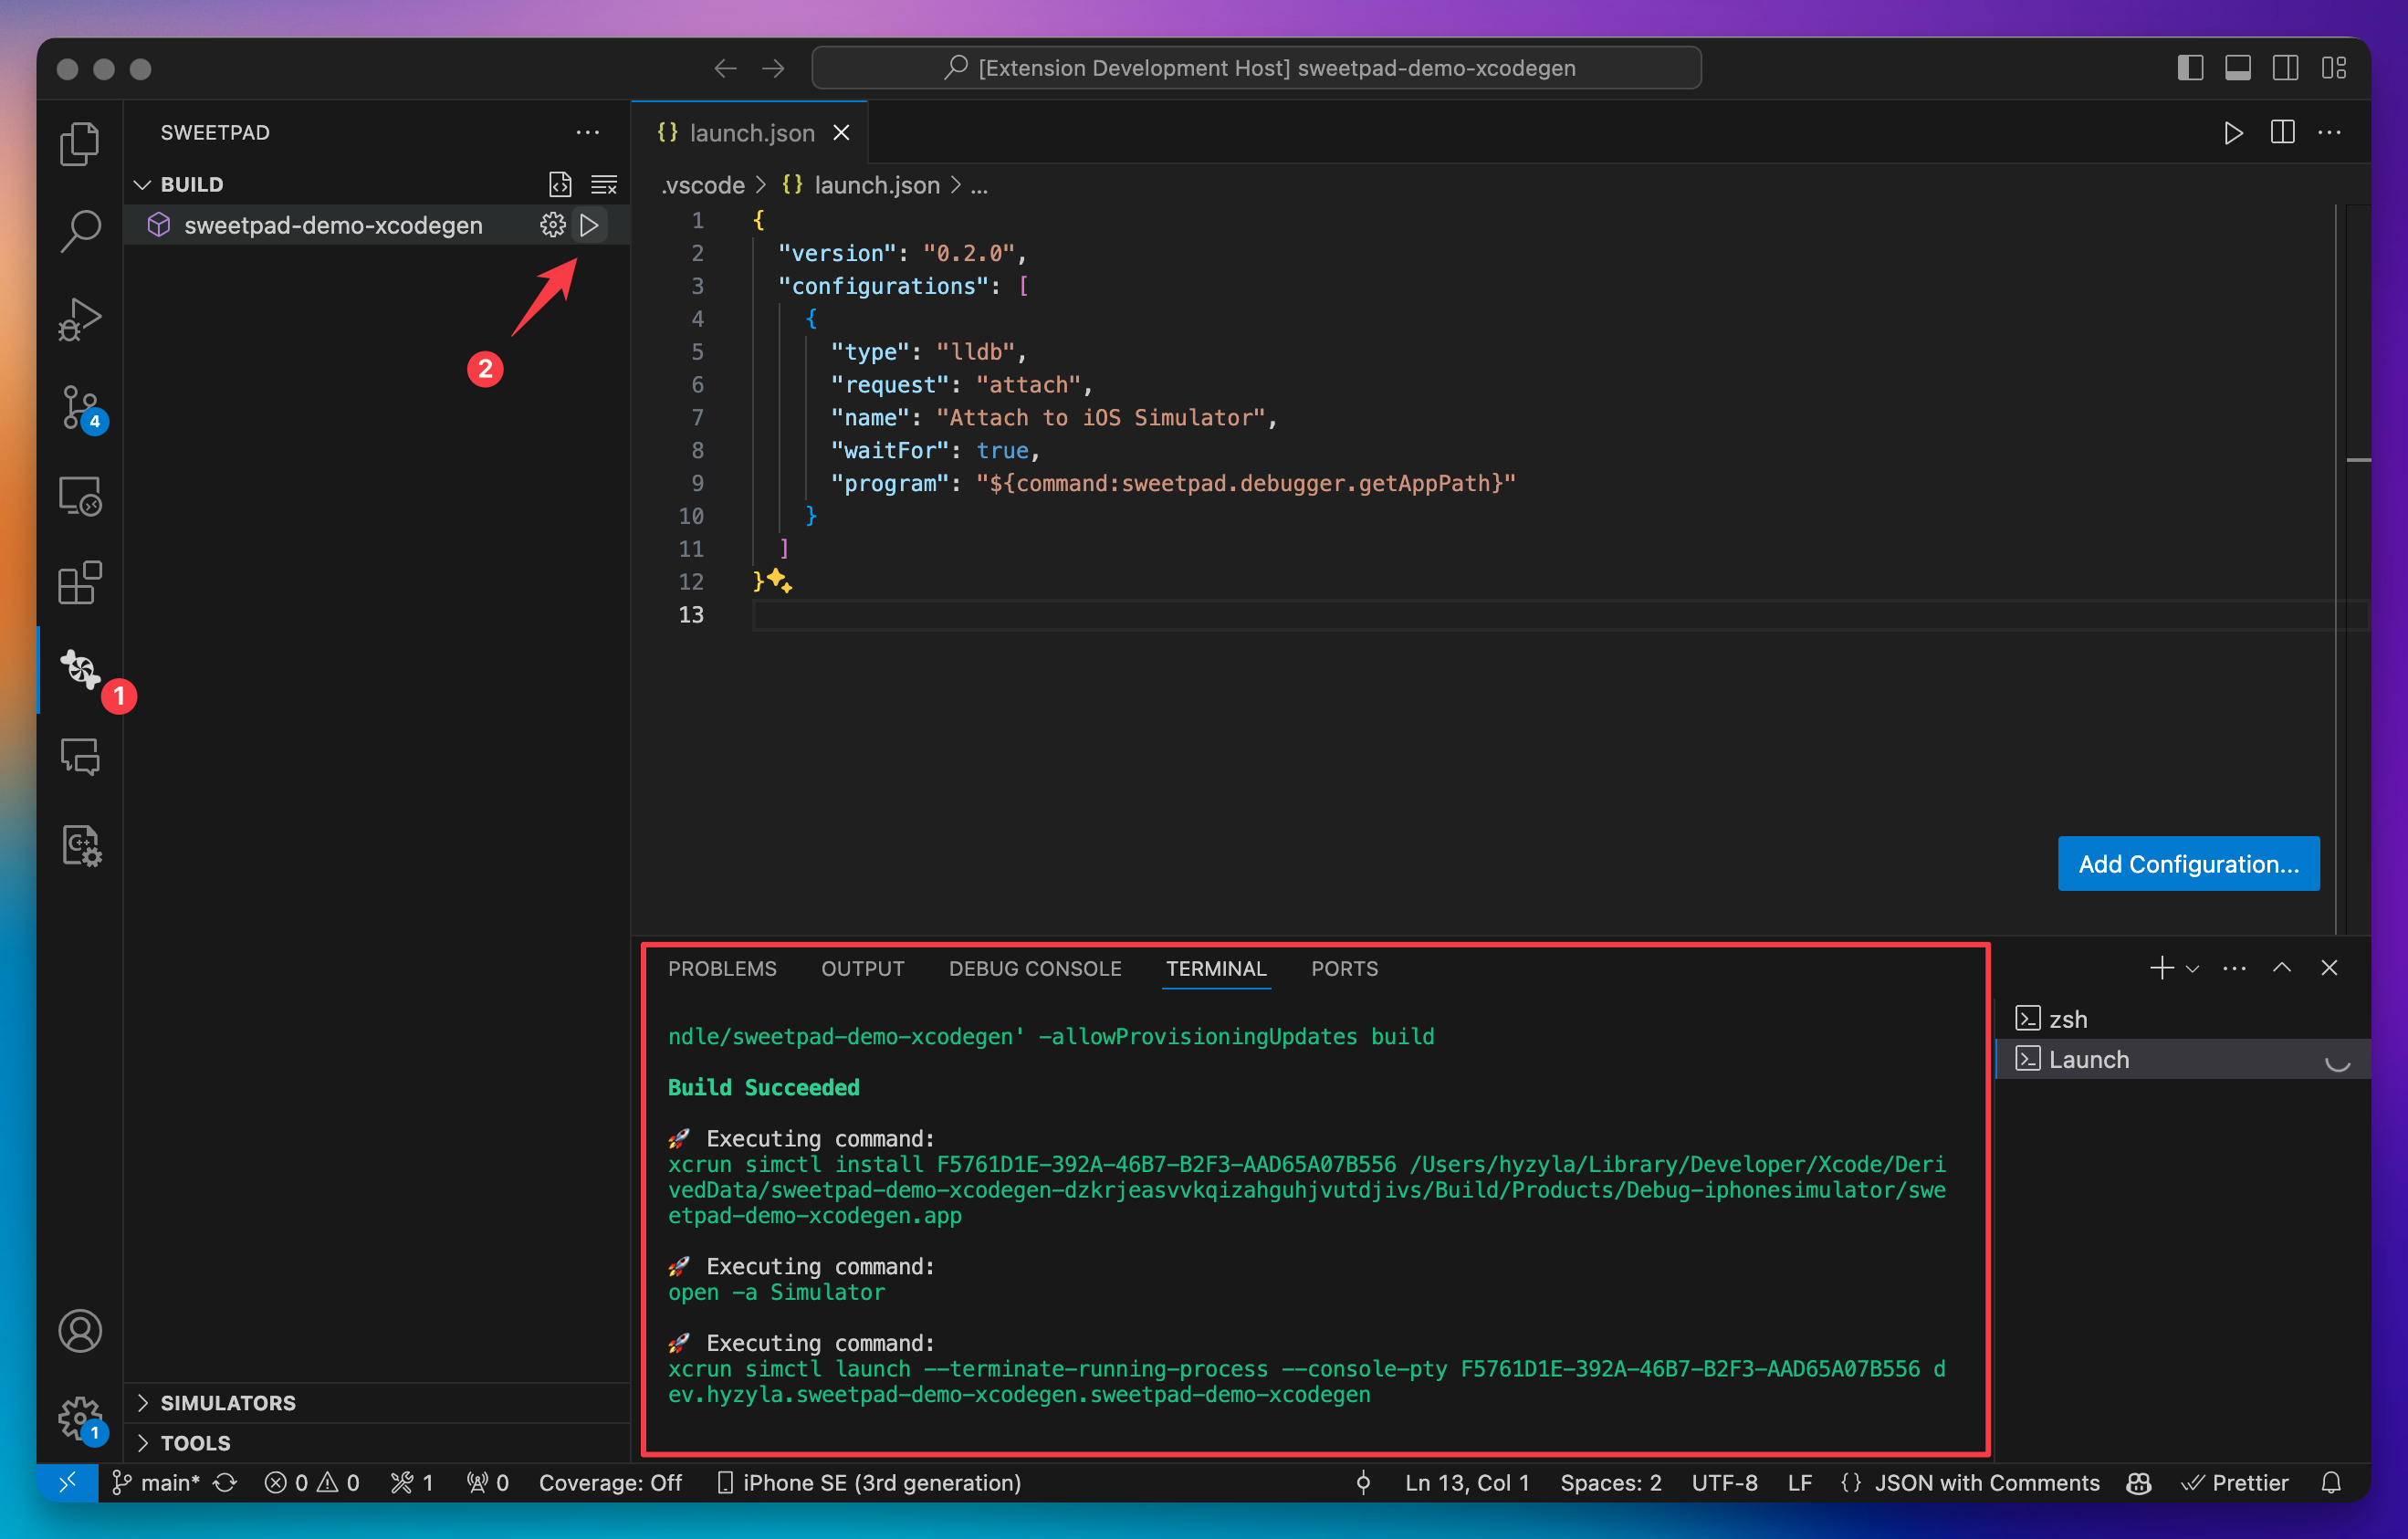
Launch the app. Start the iOS Simulator and run SweetPad › Launch from the Build panel.
-
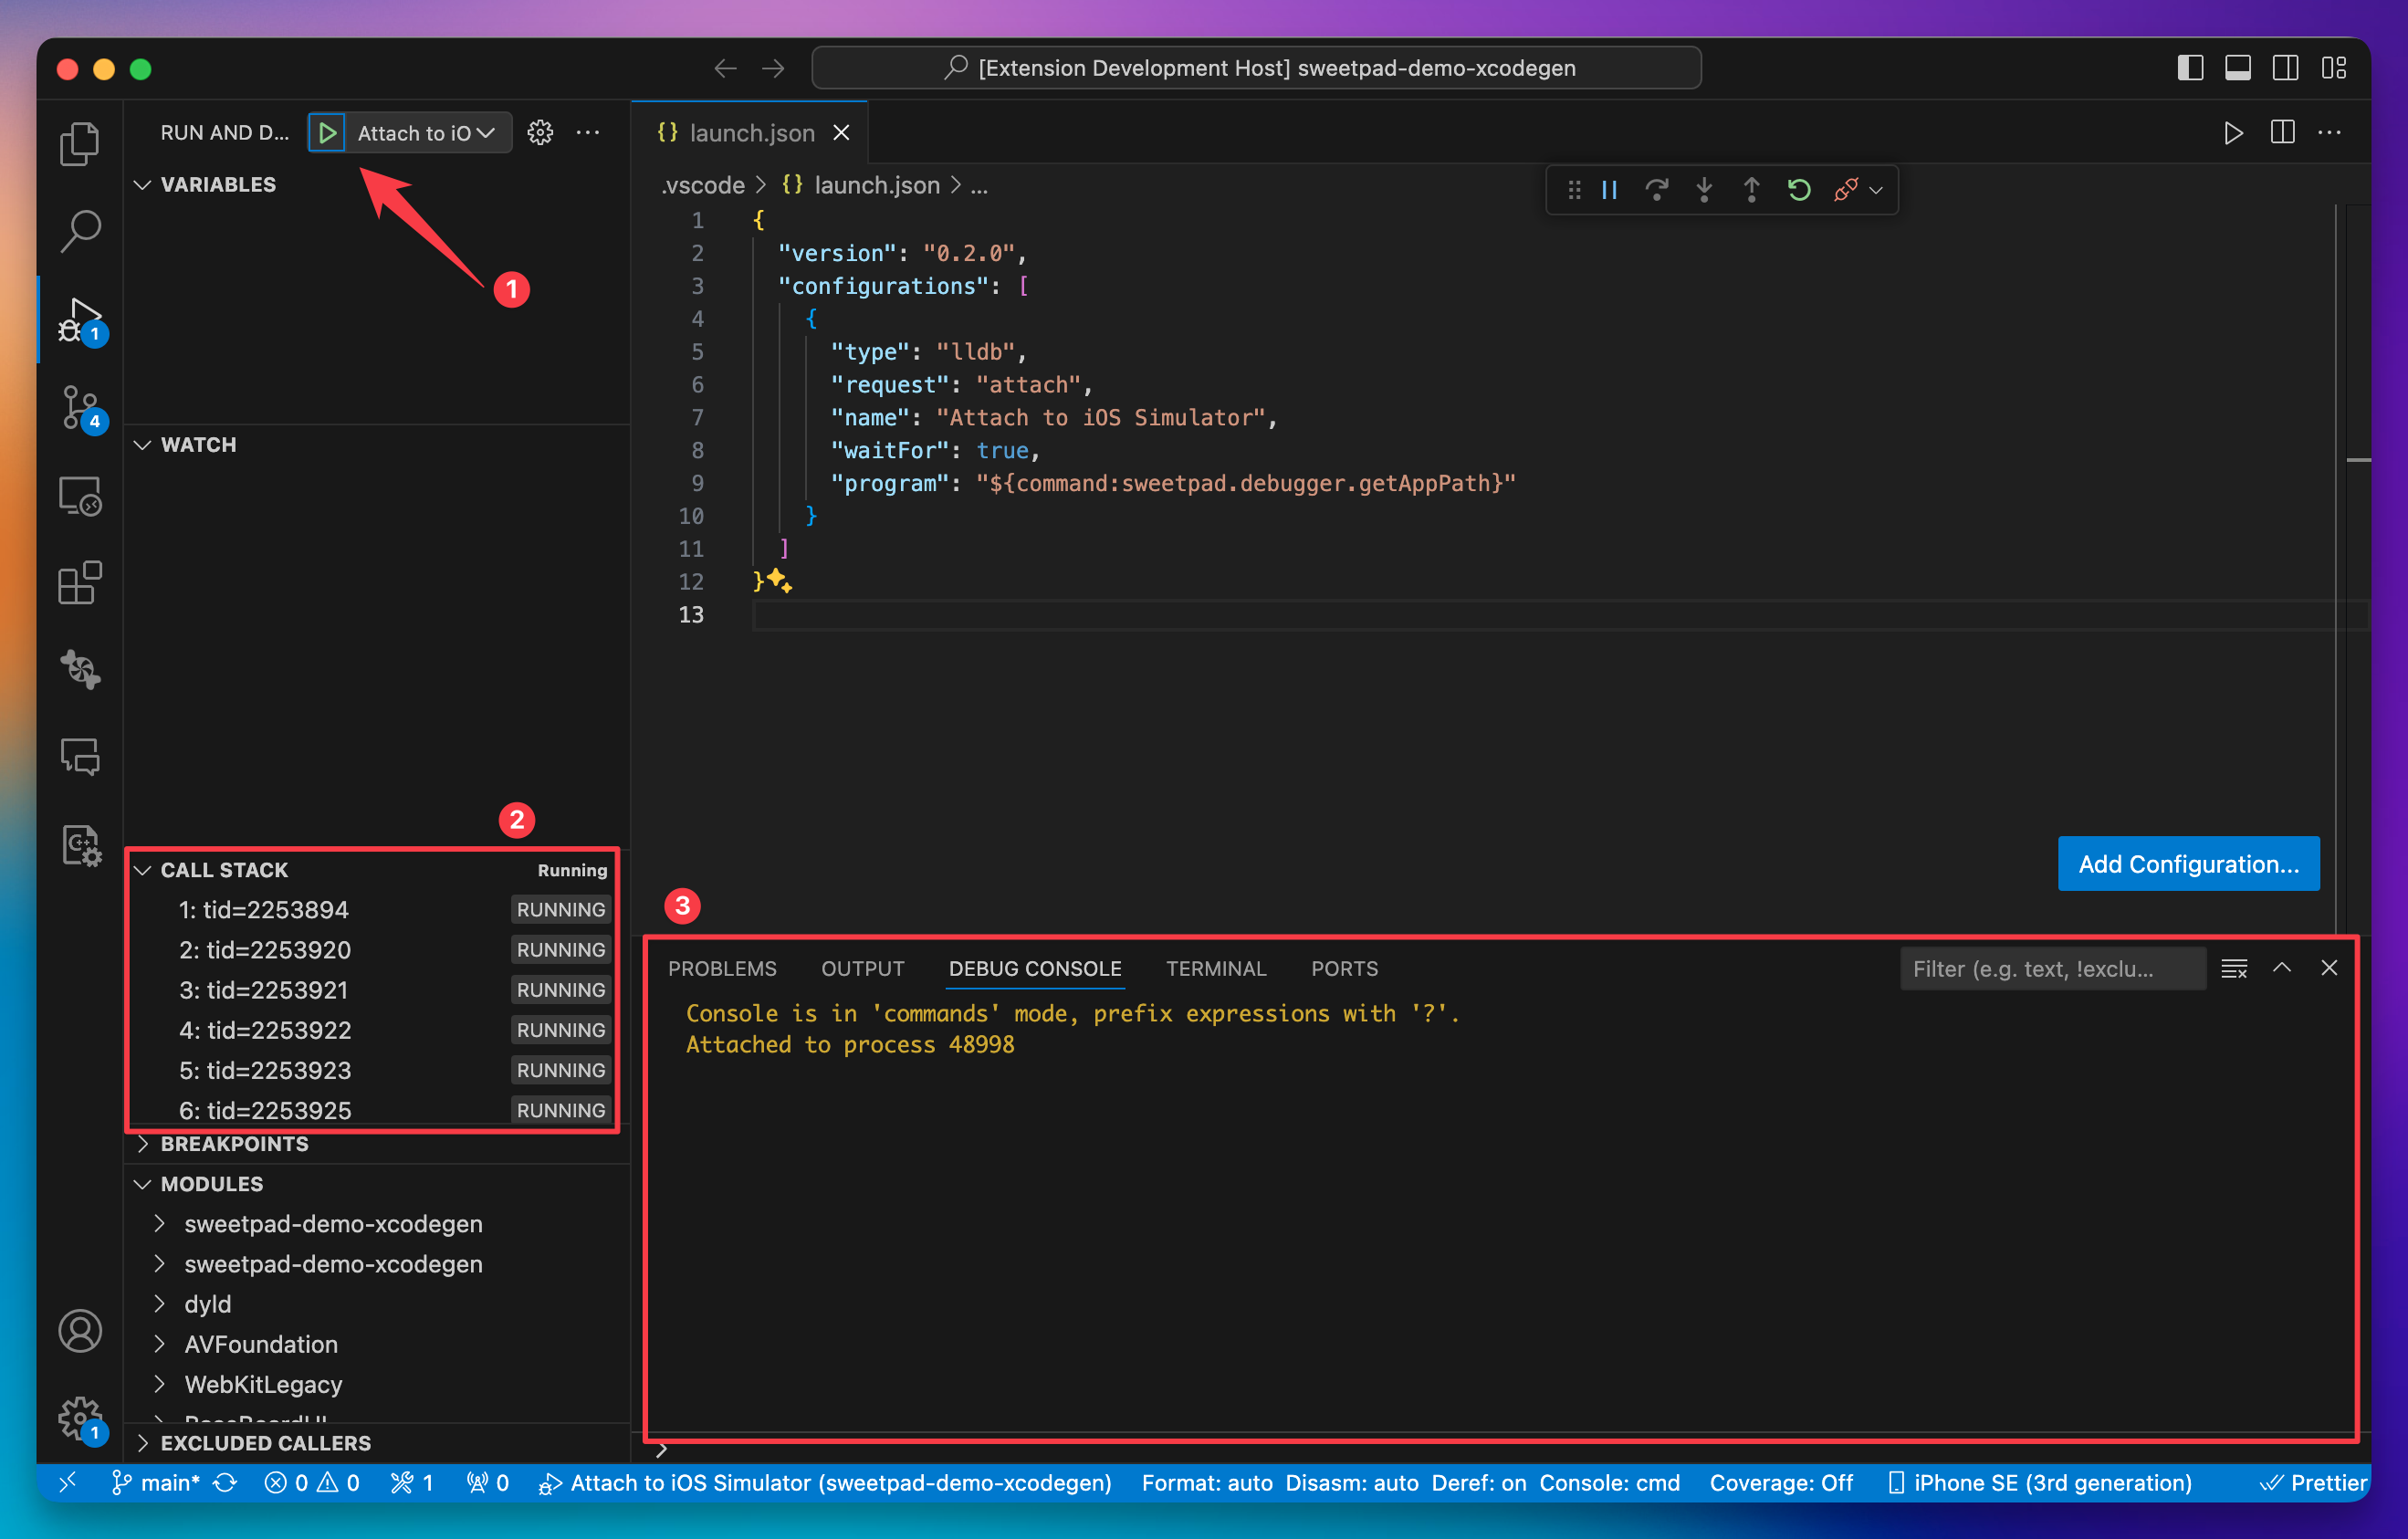
Attach the debugger. In the Run and Debug panel, select Attach to iOS Simulator. When the Call Stack appears, the debugger is successfully attached.
-
Debug. Set breakpoints and debug as usual. For subsequent sessions, skip straight to step 4.